- Interviewer: (HS), University of Glasgow, UK
- Interviewee: (YA), Institute for Korean Regional Studies, Seoul National University, S.Korea.
Introduction
While there’s limited knowledge about North Korea’s farming system and food chain, it’s evident that soil degradation has been an ongoing concern for the nation. To gain deeper insights, I spoke with Dr. Yoosoon An, a renowned agent-based modeller from South Korea. His PhD research delved into land degradation and declining food production in North Korea during the 1990s using Agent-Based Modelling (ABM).
HS: Can you introduce yourself?
YA: Certainly. I’m Dr. Yoosoon An, a research fellow at the Institute for Korean Regional Studies at Seoul National University. My primary research interests are North Korea, Agent-Based Modelling, and the relationship between soil health and food security. I can’t believe I’ve been modelling ABM for nearly a decade!
HS: Can you give a brief overview of your research?
YA: During my academic journey, I was deeply intrigued by issues related to land degradation and landslides. But what really caught my attention was reading about the North Korean famine in the 1990s. It’s heartbreaking to think about it. Basically, in the mid-90s, North Korea faced this huge famine. It wasn’t just because of natural disasters like droughts, but also due to the economic chaos after the Soviet Union collapsed, and some big problems in their farming systems. This just destroyed their land, and so many people almost starved. You can find more details on its Wikipedia page.
HS: What part of social simulation would you like to introduce to the community?
YA: Well for ABM right? I’d like to introduce my PhD research that explored strategies to combat land degradation and food shortages in North Korea, with a special emphasis on the devastating famine of the 1990s (An 2020). Although there’s a clear connection between land degradation and famine, both issues are intricate and there’s limited information available, both in North Korea and globally. Through agent-based modelling (ABM), my study examined the interplay between land degradation and the decline in food production as a pivotal factor behind North Korea’s major famine in the 1990s. This “vicious cycle of land degradation”, where agricultural productivity drops because of worsening land conditions, and then the land degrades further as people intensively cultivate it to compensate, plays a central role in the broader challenges of devastation, famine, and poverty.
I utilised ABM to look at land cover changes and posited scenarios to hypothesise the potential outcomes, given alternate policies during the 1990s. Through this research, I aimed to unravel the intricacies of the relationship between land degradation and food production, providing insights that may pave the way for future policy development and intervention strategies in analogous situations.
HS: So, you’re focusing on the famine from the ’90s, but what made you decide to simulate from the 1960s?
YA: The 1960s hold significance for several key reasons. After North Korea adopted the “shared ownership system” in 1946, private land ownership was permitted. But by 1960, following the Korean War, these private lands had been integrated into collective farms. Most of today’s agricultural practices in North Korea can be traced back to that period. Furthermore, my research pointed out a noticeable increase in documentation and data collection beginning in the 1960s, underscoring its importance. From a socio-ecological perspective, I believe that the famine was a culmination of multiple intersecting crises including the one that took place in 1995. Starting the simulation from the 1960s, and tracking land cover changes up to 2020, seemed the most comprehensive approach to understanding the intricate dynamics at play.
The Agent-based Model: the “North Korean Collective Farm”
HS: Let’s delve deeper into your model. The incorporation of both land use and human agents is particularly fascinating. Could you break down this concept figure for us before we discuss the simulation?
YA: Of course. If you refer to Figure 1, it visually represents the farm’s layout and topography. We’ve chosen to represent it through simplified square and ski-slope shapes. The model also integrates the initial forest cover to demonstrate the degradation that occurred when forests were converted into farmland. When setting the model, we positioned different land uses based on the environmental adaptation strategies traditional to the Korean people. So, you’ll notice the steeper forests situated to the north, the flatter rice fields to the south, and the villages strategically placed along the mountain edge.
YA: To give you a broader picture, the model we’ve termed the “North Korean Collective Farm” (as shown in Figure 1) is a composite representation of collective farms. In this model, a collective farm is visualised as a community where several farmers either co-own their land, reflecting cooperative farming practices (akin to the “Kolkhoze” in the Soviet Union) or as part of a state-owned agricultural entity (resembling the state farm or “Sovkhozy” from the Soviet Union). North Korea embraced this model in 1954 and by 1960 had fully transitioned all its farms into this system. While there’s a dearth of comprehensive data about North Korean collective farms, a few studies offer some general insights. Typically, a farm spans between 550 and 750 hectares, roughly equivalent to ‘Ri’, North Korea’s smallest administrative unit. On average, each of these farms accommodates 300-400 households, which translates to 700-900 active workers and a total of 1900-2000 residents. These farms are further segmented into 5-10 workgroups, serving as the foundational unit for both farming activities and the distribution of yield.
HS: So, in areas where there’s a lack of specific data or where details are too diverse to be standardised, you’ve employed abstraction and summarisation. This approach to modelling seems pragmatic. When you mention setting the initial agricultural land cover to 30% rice fields and 70% other farmland, is this a reflection of the general agricultural makeup in North Korea? Would this distribution be typical or is it an average derived from various sources?
YA: Exactly. Given the limited and sometimes ambiguous data regarding North Korea, abstraction and summarization become invaluable tools for our model. The 30% rice fields and 70% other farmland distribution is a generalised representation derived from an aggregate of available North Korean land use data. While it might not precisely mirror any specific farm, it provides a reasonable approximation of the agricultural landscape across the region. This method allows us to capture the essential features and dynamics without getting mired in the specifics of any one location.

Figure 1. Conceptual model of the Artificial North Korean Collective Farm: integrating land use and human agents to build an agent-based model for mitigating famine risk in North Korea.
HS: Okay so let’s talk about agents. So, you’ve focused on the ‘cooperative farm’ as a representative agent in your model. This is essentially to capture the intricacies of the North Korean agricultural landscape. Can you expand a bit more on how the ‘cooperative farm’ reflects the realities of North Korean agriculture and how the LUDAS framework enhances this?
YA: Certainly. The ‘cooperative farm’ or ‘cooperative household’ is more than just a symbolic entity. It encapsulates the very essence of North Korean agricultural practices. Beginning in the 1960s and persisting to the present day, these cooperative structures are foundational to the nation’s farming landscape. Notably, their geographical boundaries often align with administrative units, making them not just agricultural but also socio-political entities. When we employ broader system dynamics models that span the entirety of North Korea, often the granularity and the subtleties can get lost. Hence, zooming into the cooperative farm level provides us with the precision and detail needed to observe intricate dynamics and interactions.
YA: Another important reason is to apply the Land-use dynamic simulator (LUDAS) framework for the case of North Korea. Now, speaking of LUDAS – this framework was chosen for its ability to seamlessly bridge biophysical and socio-economic parameters. It’s a holistic approach that factors in long-term land use/cover changes against a backdrop of varied management, planning, and policy scenarios. The strength of LUDAS lies in its capability to encapsulate the intertwined dynamics of human-environment interactions. Through a multi-agent simulation process, LUDAS effectively mirrors real-world causal mechanisms, feedback loops, and interactions. By integrating this framework into our model, we aimed to offer a comprehensive portrayal of North Korea’s agricultural landscape, rich in both depth and breadth.
HS: How do the agents decide their actions and movements?
YA: Agent decisions are based on a simple principle: when they require more food, they change their work strategy and land use. Their decisions are divided into two categories: labour allocation and land-use changes. If their labour-to-food demand ratio exceeds 1, they redirect their labour and change their land use. If this ratio is less than one, they will stick to their previous strategies.
YA: In terms of labour allocation, we assume that a worker is available 300 days per year, working 8 hours per day. The minimum labour required to cultivate an average crop on a 100m2 rice field is 36 hours per year and 48 hours for other crops. These figures are based on South Korean farming data because North Korean data is unavailable. Our model initially used 6 hours for rice and 8 hours for other crops, but these settings had no effect. As a result, we changed the hours to better reflect conditions in North Korea.
YA: Agents with a food demand ratio of less than one will allocate their labour time based on our initial assumption (if this is the first year) or on the previous year’s allocation. If the ratio exceeds one, they adjust their time allocation based on soil productivity. They will first reduce or eliminate investment in less productive lands, then devote more time to more fertile areas. The labour efficiency metric is determined by comparing the current labour time to the initially assumed time. If you have time you can take a look at Equation (3) mentioned in the paper (An & Park 2023).
HS: So, in essence, how does this environment shape the behaviour and choices of the agents?
YA: The agents operate within the landscape-environmental system, which is a subsystem influenced by the LUDAS framework. This system offers a detailed insight into land degradation and food production processes specific to North Korea. Comprising five unique submodules, it considers the biological, physical, and chemical properties of the soil, coupled with a quality index for the soil and a final metric that evaluates potential food yield by integrating these factors. All these elements together determine how agents adapt and make decisions based on the changing environment.
HS: How did you decide on a one-year interval for your simulation, especially in the context of Discrete Event Simulation?
YA: In places with a temperate to cold climate like North Korea, farming activities primarily follow an annual rhythm. Apart from this agricultural reasoning, my decision was, in part, based on the data availability. The datasets I had access to didn’t provide more detailed time frames. However, considering that many nations’ agricultural practices revolve around an annual cycle, it made sense to align both environmental and socioeconomic indicators with this timeframe. Still, I’m eager to eventually incorporate more granular data, such as monthly datasets, to explore the nuanced seasonal changes in land cover.
HS: Can you explain this loop diagram for us?
YA: The diagram presents a feedback loop related to land use happening every year in the simulation. When land productivity goes down because of overuse, there’s a greater demand for food. This greater demand then causes people to use the land more, further decreasing its quality. This continuous cycle results in ongoing harm to the land, and thus increases the food pressure for the agents also known as cooperative farms.
YA: Essentially, the loop demonstrates that “lower land productivity leads to more demand for food, which then causes even more intensive land use, further reducing the land’s quality.” In our study, we noticed that as the quality of the land decreased steadily, the decrease in the food it produced was much faster. This suggests that the effects get stronger with each cycle due to the feedback loop.
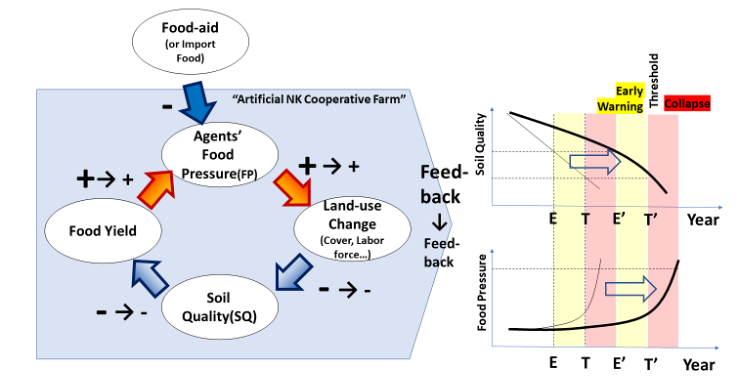
Figure 2. A feedback loop that connects land degradation and soil quality, subsequently inducing food pressure on agents. Within this loop, two critical points are identified: “E,” representing an early warning signal, and “T,” representing a threshold. Crossing this threshold can lead to a systematic collapse.
HS: Given the challenges associated with gathering information on North Korea, how did you ensure the validity of your model’s results?
YA: Validating the outcomes, especially for North Korea, was indeed challenging. For the environmental aspects, we relied on satellite imagery and referenced previous research data to validate our variables. When it came to the human agents, we tapped into an extensive array of literature and data on North Korean cooperative farms. We kept the behavioural rules for these agents straightforward, for instance, they’d modify their behaviours when faced with hunger, prioritise maximising land productivity, and turn to inter-mountain cultivation if they encountered continued food shortages. As for variables like labour hours and land potential, we began with South Korean data due to the absence of precise data from the North. Then, based on the outcomes of our iterative simulations, we made necessary adjustments to ensure the model aligned as closely as possible with reality.
HS: Before we dive into the findings, I just wanted to hear your opinion on Proof-Of-Concept (POC) models because you employed POC for your simulation. Can you discuss the advantages and limitations of using such models?
YA: POC models are particularly effective in scenarios with limited data availability. Despite the data constraints from North Korea, the consistency in their reports allowed me to simulate the progression of land degradation over time. POC models often have an intuitive interface, enabling easy adjustments and scenario applications. Debugging is also straightforward. However, the results can sometimes lack precise real-world applicability. Adding data or algorithms necessitates an abstraction process, which can introduce inaccuracies. For instance, equating one grid pixel to a household can oversimplify the model. Additionally, the interface might sometimes be less intuitive.
YA: I aimed to represent the food sustainability and socio-ecological systems in northeastern Asia, encompassing both China and the Korean peninsula. However, due to the lack of data for North Korea, I used a Proof-of-Concept model instead.
Findings
HS: From your simulations, what were the main insights or conclusions you drew?
YA: Our baseline simulation of the North Korean cooperative farm model painted a concerning picture. It revealed a vicious cycle where land degradation led to decreased food production, eventually culminating in a famine. Beginning the simulation from 1960, our model anticipated a famine occurring approximately 35 years later, which aligns with the real-world famine of 1995 in North Korea. You can take a look at Figure 3.
YA: On introducing the additional food supply scenario, we observed a delay in the onset of the famine. This finding highlights the significance of addressing the isolated nature of North Korea when aiming to prevent famine. However, it’s imperative to understand that merely making the food system more accessible isn’t a silver bullet. Comprehensive solutions must also focus on various other interventions.
HS: Based on your research, what are the potential solutions to address the future food crisis in North Korea?
YA: Our model highlights a feedback loop that intensifies food scarcity as land quality degrades. One approach we tested was enhancing external food supply. The results showed that this strategy can slow down the threat of famine, but it doesn’t completely break the loop. Even with more food coming in, the core issue—deteriorating land quality—remains unresolved.
YA: Several alternatives to address this feedback loop include adopting sustainable agricultural practices, supplementing with external energy sources, or restructuring North Korea’s collective farming system. We’re still working on modelling these solutions effectively.
YA: Historically, the Korean Peninsula faced severe famines in the 1600s, attributed to factors like climatic changes, deforestation, and diplomatic isolation. These circumstances resemble North Korea’s recent famine in the 1990s. The underlying problem in both cases is a cycle where declining land productivity demands more food production, further harming the land.
YA: Considering this historical context, it’s possible to argue that the Korean Peninsula, by itself, might not sustain its population and environment without external help. Supplying food and energy from outside might be more of a temporary solution, giving us time to seek more permanent ones.
YA: To genuinely address the land and food problem, we need to explore and test alternatives further. This could involve sustainable farming methods, efficient agricultural systems, and broader diplomatic actions for international trade and cooperation. The ultimate goal is a sustainable future for both North Korea and the entire Korean Peninsula.
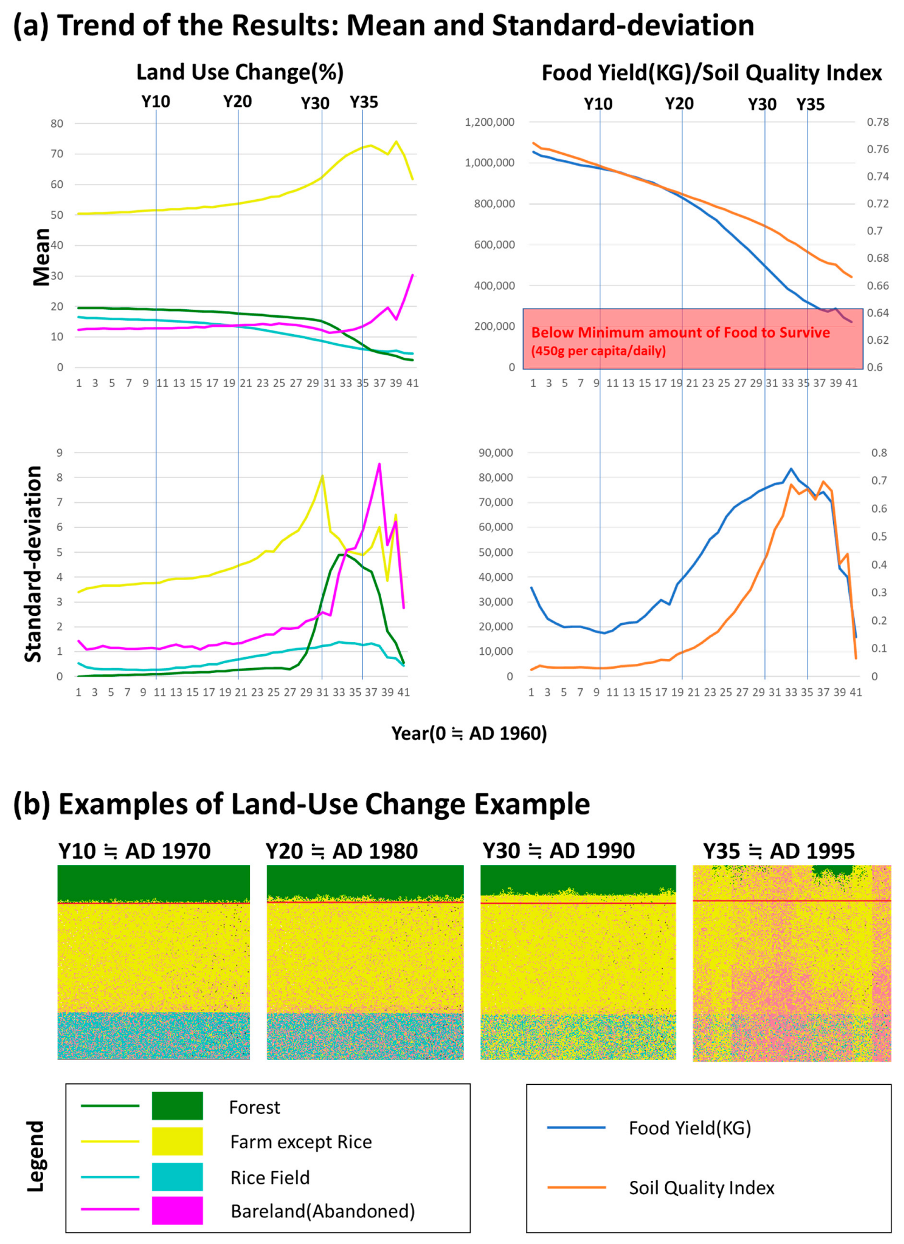
Figure 3. Summary of the results for replicability of the great famine in the 1990s: (a) Mean and standard deviation trends of land-use change (left) and food yield and soil quality (right); (b) Examples of land-use change in the model (NetLogo Interface)
Other Stories
HS: Can you share more stories from your research journey?
YA: When starting my PhD, the initial idea was to build upon my Master’s thesis about the North Korean land degradation-famine model, known as the “Pyong-an-do Model”. To note, Pyong-an-do (pronounced as doe a deer) is a province that encompasses Pyongyang, the capital, and the surrounding regions. However, data limitations made progress challenging. Around mid-2018, a visiting professor in ecological modelling suggested simplifying the model, sparking the concepts of “creating a virtual North Korea” and “establishing a virtual collective farm.”
YA: By July 2018, with a basic model ready, I applied to present at the Computational Social Science (CSS) 2018 conference. Unbeknownst to me, a full paper was required beyond just an abstract. Thankfully, the Computational Social Science Society of the Americas (CSSSA) provided an extra two weeks for submission due to the intriguing nature of the topic. That intense fortnight saw a majority of my thesis chapter being written!
YA: During the conference, a grad student from India pointed out that the results from my model, which predicted the collapse of North Korea’s farm system in around 35 years, had some eerie similarities to what happened in India and Ghana after the British messed around with their agriculture. They faced famines about 30-40 years later. He even mentioned maybe I should look into making a more general famine model, and brought up Dr. Amartya Sen’s thoughts on freedom, inequality, and development. I thought it was a cool idea, but more like a long-term idea for me.
YA: Fast forward to early 2021, I conducted interviews with experts and North Korean defectors about my model’s findings. While some feedback was beyond my thesis’ scope or challenging to incorporate, a comment from a defector with agricultural expertise stood out. He mentioned that, contrary to criticisms, the model’s depiction of nearly abandoned agricultural lands in North Korea during the early 1990s mirrored reality, further validating the accuracy of my work.
HS: For those interested in delving deeper, where can they access your model?
YA: You can find the model on my Github account (An 2023). Additionally, I’m considering publishing it on comses.net for broader accessibility and collaboration.
Date of Interview: Feb 2023, Translated into English: Sep 2023.
References
An. Y(2020), A Study on Land Degradation and Declining Food Production based on the Concept of Complex Adaptive System: Focusing on the North Korean Famine in the 1990s (Doctoral dissertation), Seoul National University (in Korean with English Abstract). link
An, Y and Park S.J (2023), Developing an Agent-Based Model to Mitigate Famine Risk in North Korea: Insights from the “Artificial North Korean Collective Farm” Model, Land, 12(4), 735 https://doi.org/10.3390/land12040735
An, Y (2023) Artificial_NK_cooperative_farm_model: https://github.com/newsoon8/Artificial_NK_cooperative_farm_model
Shin, H. & An, Y. (2023) How Agent-based Models Offer Insights on Strategies to Mitigate Soil Degradation in North Korea: A Conversation with Dr. Yoosoon An. Review of Artificial Societies and Social Simulation, 25 Oct 2023. https://rofasss.org/2023/10/25/Interview-Yoosoon-An
© The authors under the Creative Commons’ Attribution-NoDerivs (CC BY-ND) Licence (v4.0)


