Tag Archives: JASSS-Covid19-Thread

Policy modelling requires a multi-scale, multi-criteria and diverse-framing approach

Lessons from a session at SocSimFest 2023

By Gary Polhill and Juliette Rouchier

Bruce Edmonds organized a stimulating session at the SocSimFest held 15-16 March 2023. Entitled, “How to do wrong using Social Simulation – as a result of arrogance, laziness or ill intent.” One of the presentations (Rouchier 2023) covered the modelling used to justify lockdowns in various countries. This talk concentrated on the harms lockdowns caused and suggested that they were unnecessary; a discourse that is not the most present in the media and takes an alternative view to the idea that a scientific consensus exists in real-time and could lead to the best decision. There was some ‘vigorous’ debate afterwards, but here we expand on an important point that came out of that debate: Modelling the effects of Covid to inform policy on managing the disease requires much more than epidemiological modelling. We might speculate, then, whether in general, modelling for policy intervention means ensuring greater coverage of the wider system than might be deemed strictly necessary for the immediate policy question in hand. Though such speculation has apparent consequences for model complicatedness that go beyond Sun et al.’s (2016) ‘Medawar zone’ for empirical ABM, there is an interpretation of this requirement for extended coverage that is also compatible with preferences for simpler models.

Going beyond the immediate case of Covid would require the identification of commonalities in the processes of decision making that could be extrapolated to other situations. We are less interested in that here than making the case that simulation for policy analysis in the context of Covid entails greater coverage of the system than might be expected given the immediate questions in hand. The expertise of Rouchier means our focus is primarily on the experience of Covid in France. Generalisation of the principle to wider coverage beyond this case is a matter of conjecture that we propose making.

Handling Covid: an evaluation that is still in progress

Whether governments were right or wrong to implement lockdowns of varying severity is a matter that will be for historians to debate. During that time various researchers developed models, including agent-based models, that were used to advise policymakers on handling an emergency situation predicated on higher rates of mortality and hospitalisation.[1] Assessing the effectiveness of the lockdowns empirically would require us to be able to collect data from parallel universes in which they were not implemented. The fact that we cannot do this leaves us, as Rouchier pointed out, either comparing outcomes with models’ predictions – which is problematic if the models are not trusted – or comparing outcomes across countries with different lockdown policies – which has so far been inconclusive even if it weren’t problematic because of differences in culture and geography from one nation to another. Such comparison will nevertheless be the most fruitful in time, although the differences of implementation among countries will doubtless induce long discussions about the most important factors to consider for defining relevant Non-Pharmaceutical Interventions (NPI).[2]

The effects of the lockdowns themselves on people’s mental and physical health, child development, and on the economy and working practices, are also the subject of emerging data post-lockdown. Some of these consequences have been severe – not least for the individuals concerned. Though not germane to the central argument of this brief document, it is worth noting that the same issue with unobservable parallel universes means that scientific rather than historical assessment of whether these outcomes are better or worse than any outcomes for those individuals and society at large in the absence of lockdowns is also impossible.

For our purposes, the most significant aspect of this second point is that the discussion has arisen after the epidemic emergency: First, it is noteworthy that these matters could perfectly well have been considered in models during the crisis. Indeed, contrasting the positive effect (saving lives or saving a public service) with negative effects (children’s withdrawal from education,[3] increasing psychological distress, not to mention domestic abuse – Usta et al. 2021) is typically what cost-benefit analysis, based on multi-criteria modelling, is supposed to elicit (Roy, 1996). In modelling for public policy decision-making, it is particularly clear that there is no universally ‘superior’ or ‘optimum’ indicator to be used for comparing options; but several indicators to evaluate diverse alternative policies. A discussion about the best decision for a population has to be based on the best description of possible policies and their evaluations according to the chosen indicators (Pluchinotta et al., 2022). This means that a hierarchy of values has to be made explicit to justify the hierarchy of most important indicators. During the Covid crisis one question that could have been asked (should it not have been) is: who is the most vulnerable population to protect? Is it old people because of disease or young people because of potential threats to their future chances in life?

Second, it is clear that this answer could vary in time with information and the dynamics of variant of Covid. For example, as soon as Omicron was announced by South Africa’s doctors, it was said to be less dangerous than earlier variants.[4] In that sense, the discussion of balancing priorities, in a dynamic way, in this historical period is very typical of what could also be central in other public discussions where the whole population is facing a highly uncertain future, and where the evolution of knowledge is rapid. But it is difficult to know in advance which indicators should be considered since some signals can be very weak at some point in time, but then be confirmed as highly relevant later on – essentially this is the problem of the omitted-variable bias.

The discussion about risks to mental health was vivid in 2020 already: some psychologists were soon showing the risk for people with mental health issues or women with violent husbands;[5] while the discussion about effects on children started early in 2020 (Singh et al., 2020). However this issue only started to be considered publicly by the French government a year and a half later. One interpretation of the time differential is that the signal seemed too weak for non-specialists early on, when the specialists had already seen the disturbing signs.

In science, we have no definitive rule to decide when a weak signal at present will later turn out to be truly significant. Rather, it is ‘society’ as a whole that decides on the value of different indicators (sometimes only with the wisdom of hindsight) and scientists should provide knowledge on these. This goes back to classical questions of hierarchy of values about the diverse stakes people hold in questions that recur perennially in decision science.

Modelling for policy making: tension between complexity and elegance?

Edmonds (2022) presented a paper at SSC 2022 outlining four ‘levels’ of rigour needed when conducting social simulation exercises, reserving the highest level for using agent-based models to inform public policy. Page limitations for conference submissions meant he was unable to articulate in the paper as full a list of the stipulations for rigour in the fourth level as he was for the other three. However, Rouchier’s talk at the SocSimFest brought into sharp focus that at least one of those stipulations is that models of public policy should always have broader coverage of the system than is strictly necessary for the immediate question in hand. This has the strange-seeming consequence that exclusively epidemiological models are inadequate to the task of modelling how a contagious illness should be controlled. For any control measure that is proposed, such a stipulation entails that the model be capable of exploring not only the effect on disease spread, but also potential wider effects of relevance to societal matters generally in the domain of other government departments: such as, energy, the environment, business, justice, transportation, welfare, agriculture, immigration, and international relations.

The conjecture that for any modelling challenge in complex or wicked systems, thorough policy analysis entails broader system coverage than the immediate problem in hand (KIDS-like – see Edmonds & Moss 2005), is controversial for those who like simple, elegant, uncomplicated models (KISS-like). Worse than that, while Sun et al. (2016), for example, acknowledge that the Medawar zone for empirical models is at a higher level of complicatedness than for theoretical models, the coverage implied by this conjecture is broader still. The level of complicatedness implied will also be controversial for those who don’t mind complex, complicated models with large numbers of parameters. It suggests that we might need to model ‘everything’, or that policy models are then too complicated for us to understand, and as a consequence, perhaps using simulations to analyse policy scenarios is inappropriate. The following considers each of these objections in turn with a view to developing a more nuanced analysis of the implications of such a conjecture.

Modelling ‘everything’ is a matter that is the easiest to reject as a necessary implication of modelling ‘more things’. Modelling, say, the international relations implications of proposed national policy on managing a global pandemic, does not mean one is modelling the lifecycle of extremophile bacteria, or ocean-atmosphere interactions arising from climate change, or the influence of in-home displays on domestic energy consumption, to choose a few random examples of a myriad things that are not modelled. It is not even clear what modelling ‘everything’ really means – phenomena in social and environmental systems can be modelled at diverse levels of detail, at scales from molecular to global. Fundamentally, it is not even clear that we have anything like a perception of ‘everything’, and hence no basis for representing ‘everything’ in a model. Further, the Borges argument[6] holds in that having a model that would be the same as reality makes it useless to study as it is then wiser to study reality directly. Neither universal agreement nor objective criteria[7] exist for the ‘correct’ level of complexity and complication at which to model phenomena, but failing to engage with a broader perspective on the systemic effects of phenomena leaves one open to the kind of excoriating criticism exemplified by Keen’s (2021) attack on economists’ analysis of climate change.

At the other end of the scale, doing no modelling at all is also a mistake. As Polhill and Edmonds (2023) argue, leaving simulation models out of policy analysis essentially makes the implicit assumption that human cognition is adequate to the task of deciding on appropriate courses of action facing a complex situation. There is no reason (besides hubris) to believe that this is necessarily the case, and plenty of evidence that it is not. Not least of such evidence is that many of the difficult decisions we now face around such things as managing climate change and biodiversity have been forced upon us by poor decision-making in the past.

Cognitive constraints and multiple modellers

This necessity to consider many dimensions of social life within models that are ‘close enough’ to the reality to convince decision-makers induces a risk of ‘over’-complexity. Its main default is the building of models that are too complicated for us to understand. This is a valid concern in the sense that building an artificial system that, though simpler than the real world, is still beyond human comprehension, hardly seems a worthwhile activity. The other concern is that of the knowledge needed by the modeller: how can one person be able to imagine an integrative model which includes (for example) employment, transportation, food, schools, international economy, and any other issue which is needed for a serious analysis of the consequences of policy decisions?

Options that still entail broader coverage but not a single overcomplicated integrated model are: 1/ step-by-step increase in the complexity of the model in a community of practitioners; 2/ confrontation of different simple models with different hypotheses and questions; 3/ superposition and integration of simple models into one, through a serious work on the convergence of ontologies (with a nod to Voinov and Shugart’s (2013) warnings).

  1. To illustrate this first approach, let us stay with the case of the epidemic model. One can start with an epidemiological simulation where we fit to the fact that if we tell people to stay at home then we will cut hospitalizations by enough that health services will not be overwhelmed. But then we are worried that this might have a negative impact on the economy. So we bring in modelling components that simulate all four combinations of person/business-to-person/business transactions, and this shows that if we pay businesses to keep employees on their books, we have a chance of rebooting the economy after the pandemic is over.[8] But then we are concerned that businesses might lie about who their employees are, that office-workers who can continue to work at home are privileged over those with other kinds of job, that those with a child-caring role in their households are disadvantaged in their ability to work at home if the schools are closed, and that the mental health of those who live alone is disproportionately impacted through cutting off their only means of social intercourse. And so more modelling components are brought in. In a social context, this incremental addition of the components of a complicated model may mean it is more comprehensible to the team of modellers.

    If the policy maker really wants to increase her capacity to understand her possible actions with models, she would also have to make sure to invite several researchers for each modelled aspect, as no single social science is free of controversy, and the discussions about consequences should rely on contradictory theories. If a complex model has to be built, it can indeed propose different hypotheses on behaviours, functioning of economy, sanitary risks depending on the type of encounter.[9] It is then more of a modelling ‘framework’ with several options for running various different specific models with different implementation options. One advantage of modelling that applies even in cases where Borges argument applies, is that testing out different hypotheses is harmless for humans (unlike empirical experiments) and can produce possible futures, seen as trajectories that can then be evaluated in real time with relevant indicators. With a serious group of modellers and statisticians, providing contradicting views, not only can the model be useful for developing prospective views, but also the evaluation of hypotheses could be done rapidly.

  2. The CoVprehension Collective (2020) showed another approach, more fluid in its organisation. The idea is “one question, one model”, and the constraint is to have a pedagogic result where a simple phenomenon would be illustrated. Different modellers could realise one or several models on simple issues, so that to explain one simple phenomenon, paradox or show a tautological affirmation. In the process, the CoVprehension team would create moving sub-teams, associate on one specific issue and propose their hypotheses and results in a very simple manner. Such a protocol was purely oriented for explanation to the public, but the idea would be to organise a similar dynamic for policy makers. The system is cheap (it was self-organised with researchers and engineers, with zero funding but their salary) and it sustained lively discussions, with different points of view. Questions could go from differences between possible NPI, with an algorithmic description of these NPI that could make the understanding of processes more precise, to an explanation of the reason why French supermarkets were missing toilet paper. Twenty questions were answered in two months, thus indicating that such a working dynamic is feasible in real-time and provides useful and interesting inputs to discussion.

  3. To avoid too complicated a model, the fusion of both approaches could also be conceived: the addition of dimensions to a large central model could be first tested through simple models, the main process of explanation could be found and this process reproduced within the theoretical framework of the large model. This would constitute both a production of diversity of points of view and models and the aggregation of all points of view in one large model. The fact that the model should be large is important, as ‘size matters’ in diffusion models (e.g. Gotts & Polhill 2010), and thus simple, small models would benefit from this work as well.

As some modellers like complex models (and can think with the help of these models) and others rely on simple stories to increase their understanding of the world, only the creation of an open community of diverse specialists and modellers, KISS as well as KIDS, such a collective step-by-step elaboration could resolve the central problem that ‘too complicated to understand’ is a relative, rather than absolute, assessment. One very important prerequisite of such collaboration is that there is genuine ‘horizontality’ of the community: where each participant is listened to seriously whatever their background, which can be an issue in interdisciplinary work, especially involving people of mixed career stage. Be that as it may, the central conjecture remains: agent-based modelling for policy analysis should be expected to involve even more complicated (assemblages of) models than empirical agent-based modelling.

Endnotes

[1] This point is the one that is the most disputed ex-post in France, where lockdowns were justified (as in other countries) to “protect hospitals”. In France, the idea was not to avoid deaths of older people (90% of deaths were people older than 60, this demographic being 20% of the population), but to avoid hospitals being overwhelmed with Covid cases taking the place of others. In France, the official data regarding hospital activity states that Covid cases represented 2% of hospitalizations and 5% of Intensive Care Unit (ICU) utilizations. Further, hospitals halved their workload from March to May 2020 because of almost all surgery being blocked to keep ICUs free. (In October-December 2020, although the epidemic was more significant at that time, the same decision was not taken). Arguably, 2% of 50% not an increase that should destroy a functioning system – https://www.atih.sante.fr/sites/default/files/public/content/4144/aah_2020_analyse_covid.pdf – page 2. Fixing dysfunction in the UK’s National Health Services has been a long-standing, and somewhat tedious, political and academic debate in the country for years, even before Covid (e.g. Smith 2007; Mannion & Braithwaite 2012; Pope & Burnes 2013; Edwards & Palmer 2019).

[2] An interesting difference that French people heard about was that in the UK, people could wander on the beaches during lockdowns, whereas in France it was forbidden to go to any natural area – indeed, it was forbidden to go further than one kilometre from home. Whereas, in fact, in the UK the lockdown restrictions were a ‘devolved matter’, with slightly different policies in each of the UK’s four member nations, though very similar legislation. In England, Section 6 paragraph (1) of The Health Protection (Coronavirus, Restrictions) (England) Regulations 2020 stated that “no person may leave the place where they are living without reasonable excuse”, with paragraph (2) covering examples of “reasonable excuses” including for exercise, obtaining basic necessities, and accessing public services. Similar wording was used by other devolved nations. None of the regulations stipulated any maximum distance from a person’s residence that these activities had to take place – interpretation of the UK’s law is based on the behaviour of the ‘reasonable person’ (the so-called ‘man on the Clapham omnibus’ – see Łazowski 2021). However, differing interpretations of what ‘resonable people’ would do between the citizenry and the constabulary led to fixed penalty notices being issued for taking exercise more than five miles (eight kilometres) from home – e.g. https://www.theguardian.com/uk-news/2021/jan/09/covid-derbyshire-police-to-review-lockdown-fines-after-walkers-given-200-penalties In Scotland, though the Statutory Instrument makes no mention of any distance, people were ‘given guidance’ not to travel more than five miles from home for leisure and recreation, and were still advised to stay “within their local area” after this restriction was lifted (see https://www.gov.scot/news/travel-restrictions-lifted/).

[3] A problem which seems to be true in various countries https://www.unesco.org/en/articles/new-academic-year-begins-unesco-warns-only-one-third-students-will-return-school
https://www.kff.org/other/report/kff-cnn-mental-health-in-america-survey/
https://eu.usatoday.com/in-depth/news/health/2023/05/15/school-avoidance-becomes-crisis-after-covid/11127563002/#:~:text=School%20avoidant%20behavior%2C%20also%20called,since%20the%20COVID%2D19%20pandemic
https://www.bbc.com/news/health-65954131

[4] https://www.cityam.com/omicron-mild-compared-to-delta-south-african-doctors-say/

[5] https://www.terrafemina.com/article/coronavirus-un-psy-alerte-sur-les-risques-du-confinement-pour-la-sante-mentale_a353002/1

[6] In 1946, in El hacedor, Borges described a country where the art of building maps is so excessive in the need for details that the whole country is covered by the ideal map. This leads to obvious troubles and the disappearance of geographic science in this country.

[7] See Brewer et al. (2016) if the Akaike Information Criterion is leaping to your mind at this assertion.

[8]  Although this assumption might not be stated that way anymore, as the hypothesis that many parts of the economy would hugely suffer started to reveal its truth even before the end of the crisis: a problem that had only been anticipated by a few prominent economists (e.g. Boyer, 2020). This failure shows mainly that the description that most economists make of the economy is too simplistic – as often reproached – to be able to anticipate massive disruptions. Everywhere in the world the informal sector was almost completely stopped as people could neither work in their job nor meet for information market exchange, which causes misery for a huge part of the earth population, among the most vulnerable (ILO, 2022).

[9] A real issue that became obvious is that the nosocomial infections are (still) extremely important in hospitals, as the evaluation of the number of infections in hospitals for Covid19 are estimated to be 20 to 40% during the first epidemic (Abbas et al. 2021).

Acknowledgements

GP’s work is supported by the Scottish Government Rural and Environment Science and Analytical Services Division (project reference JHI-C5-1).

References

Abbas, M., Nunes, T. R., Martischang, R., Zingg, W., Iten, A., Pittet, D. & Harbarth, S. (2021) Nosocomial transmission and outbreaks of coronavirus disease 2019: the need to protect both patients and healthcare workers. Antimicrobial Resistance & Infection Control 10, 7. doi:10.1186/s13756-020-00875-7

Boyer, R. (2020) Les capitalismes à l’épreuve de la pandémie, La découverte, Paris.

Brewer, M., Butler, A. & Cooksley, S. L. (2016) The relative performance of AIC, AICC and BIC in the presence of unobserved heterogeneity. Methods in Ecology and Evolution 7 (6), 679-692. doi:10.1111/2041-210X.12541

the CoVprehension Collective (2020) Understanding the current COVID-19 epidemic: one question, one model. Review of Artificial Societies and Social Simulation, 30th April 2020. https://rofasss.org/2020/04/30/covprehension/

Edmonds, B. (2022) Rigour for agent-based modellers. Presentation to the Social Simulation Conference 2022, Milan, Italy. https://cfpm.org/rigour/

Edmonds, B. & Moss, S. (2005) From KISS to KIDS – an ‘anti-simplistic’ modelling approach. Lecture Notes in Artificial Intelligence 3415, pp. 130-144. doi:10.1007/978-3-540-32243-6_11

Edwards, N. & Palmer, B. (2019) A preliminary workforce plan for the NHS. British Medical Journal 365 (8203), I4144. doi:10.1136/bmj.l4144

Gotts, N. M. & Polhill, J. G. (2010) Size matters: large-scale replications of experiments with FEARLUS. Advances in Complex Systems 13 (04), 453-467. doi:10.1142/S0219525910002670

ILO Brief (2020) Impact of lockdown measures on the informal economy, https://www.ilo.org/global/topics/employment-promotion/informal-economy/publications/WCMS_743523/lang–en/index.htm

Keen, S. (2021) The appallingly bad neoclassical economics of climate change. Globalizations 18 (7), 1149-1177. doi:10.1080/14747731.2020.1807856

Łazowski, A. (2021) Legal adventures of the man on the Clapham omnibus. In Urbanik, J. & Bodnar, A. (eds.) Περιμένοντας τους Bαρβάρους. Law in a Time of Constitutional Crisis: Studies Offered to Mirosław Wyrzykowski. C. H. Beck, Munich, Germany, pp. 415-426. doi:10.5771/9783748931232-415

Mannion, R. & Braithwaite, J. (2012) Unintended consequences of performance measurement in healthcare: 20 salutary lessons from the English National Health Service. Internal Medicine Journal 42 (5), 569-574. doi:10.1111/j.1445-5994.2012.02766.x

Pluchinotta I., Daniell K.A., Tsoukiàs A. (2002), “Supporting Decision Making within the Policy Cycle: Techniques and Tools”, In M. Howlett (ed.), Handbook of Policy Tools, Routledge, London, 235 – 244. https://doi.org/10.4324/9781003163954-24.

Polhill, J. G. & Edmonds, B. (2023) Cognition and hypocognition: Discursive and simulation-supported decision-making within complex systems. Futures 148, 103121. doi:10.1016/j.futures.2023.103121

Pope, R. & Burnes, B. (2013) A model of organisational dysfunction in the NHS. Journal of Health Organization and Management 27 (6), 676-697. doi:10.1108/JHOM-10-2012-0207

Rouchier, J. (2023) Presentation to SocSimFest 23 during session ‘How to do wrong using Social Simulaion – as a result of arrogance, laziness or ill intent’. https://cfpm.org/slides/JR-Epi+newTINA.pdf

Roy, B. (1996) Multicriteria methodology for decision analysis, Kluwer Academic Publishers.

Singh, S, Roy, D., Sinha, K., Parveen, S., Sharma G. & Joshic, G. (2020) Impact of COVID-19 and lockdown on mental health of children and adolescents: A narrative review with recommendations, Psychiatry Research. 2020 Nov; 293: 113429, 10.1016/j.psychres.2020.113429

Smith, I. (2007). Breaking the dysfunctional dynamics. In: Building a World-Class NHS. Palgrave Macmillan, London, pp. 132-177. doi:10.1057/9780230589704_5

Sun, Z., Lorscheid, I., Millington, J. D., Lauf, S., Magliocca, N. R., Groeneveld, J., Balbi, S., Nolzen, H., Müller, B., Schulze, J. & Buchmann, C. M. (2016) Simple or complicated agent-based models? A complicated issue. Environmental Modelling & Software 86, 56-67. doi:10.1016/j.envsoft.2016.09.006

Usta, J., Murr, H. & El-Jarrah, R. (2021) COVID-19 lockdown and the increased violence against women: understanding domestic violence during a pandemic. Violence and Gender 8 (3), 133-139. doi:10.1089/vio.2020.0069

Voinov, A. & Shugart, H. H. (2013) ‘Integronsters’, integral and integrated modeling. Environmental Modelling & Software 39, 149-158. doi:10.1016/j.envsoft.2012.05.014


Polhill, G. and Rouchier, J. (2023) Policy modelling requires a multi-scale, multi-criteria and diverse-framing approach. Review of Artificial Societies and Social Simulation, 31 Jul 2023. https://rofasss.org/2023/07/31/policy-modelling-necessitates-multi-scale-multi-criteria-and-a-diversity-of-framing


© The authors under the Creative Commons’ Attribution-NoDerivs (CC BY-ND) Licence (v4.0)

Reply to Frank Dignum

By Edmund Chattoe-Brown

This is a reply to Frank Dignum’s reply (about Edmund Chattoe-Brown’s review of Frank’s book)

As my academic career continues, I have become more and more interested in the way that people justify their modelling choices, for example, almost every Agent-Based Modeller makes approving noises about validation (in the sense of comparing real and simulated data) but only a handful actually try to do it (Chattoe-Brown 2020). Thus I think two specific statements that Frank makes in his response should be considered carefully:

  1. … we do not claim that we have the best or only way of developing an Agent-Based Model (ABM) for crises.” Firstly, negative claims (“This is not a banana”) are not generally helpful in argument. Secondly, readers want to know (or should want to know) what is being claimed and, importantly, how they would decide if it is true “objectively”. Given how many models sprang up under COVID it is clear that what is described here cannot be the only way to do it but the question is how do we know you did it “better?” This was also my point about institutionalisation. For me, the big lesson from COVID was how much the automatic response of the ABM community seems to be to go in all directions and build yet more models in a tearing hurry rather than synthesise them, challenge them or test them empirically. I foresee a problem both with this response and our possible unwillingness to be self-aware about it. Governments will not want a million “interesting” models to choose from but one where they have externally checkable reasons to trust it and that involves us changing our mindset (to be more like climate modellers for example, Bithell & Edmonds 2020). For example, colleagues and I developed a comparison methodology that allowed for the practical difficulties of direct replication (Chattoe-Brown et al. 2021).
  2. The second quotation which amplifies this point is: “But we do think it is an extensive foundation from which others can start, either picking up some bits and pieces, deviating from it in specific ways or extending it in specific ways.” Again, here one has to ask the right question for progress in modelling. On what scientific grounds should people do this? On what grounds should someone reuse this model rather than start their own? Why isn’t the Dignum et al. model built on another “market leader” to set a good example? (My point about programming languages was purely practical not scientific. Frank is right that the model is no less valid because the programming language was changed but a version that is now unsupported seems less useful as a basis for the kind of further development advocated here.)

I am not totally sure I have understood Frank’s point about data so I don’t want to press it but my concern was that, generally, the book did not seem to “tap into” relevant empirical research (and this is a wider problem that models mostly talk about other models). It is true that parameter values can be adjusted arbitrarily in sensitivity analysis but that does not get us any closer to empirically justified parameter values (which would then allow us to attempt validation by the “generative methodology”). Surely it is better to build a model that says something about the data that exists (however imperfect or approximate) than to rely on future data collection or educated guesses. I don’t really have the space to enumerate the times the book said “we did this for simplicity”, “we assumed that” etc. but the cumulative effect is quite noticeable. Again, we need to be aware of the models which use real data in whatever aspects and “take forward” those inputs so they become modelling standards. This has to be a collective and not an individualistic enterprise.

References

Bithell, M. and Edmonds, B. (2020) The Systematic Comparison of Agent-Based Policy Models – It’s time we got our act together!. Review of Artificial Societies and Social Simulation, 11th May 2021. https://rofasss.org/2021/05/11/SystComp/

Chattoe-Brown, E. (2020) A Bibliography of ABM Research Explicitly Comparing Real and Simulated Data for Validation. Review of Artificial Societies and Social Simulation, 12th June 2020. https://rofasss.org/2020/06/12/abm-validation-bib/

Chattoe-Brown, E. (2021) A review of “Social Simulation for a Crisis: Results and Lessons from Simulating the COVID-19 Crisis”. Journal of Artificial Society and Social Simulation. 24(4). https://www.jasss.org/24/4/reviews/1.html

Chattoe-Brown, E., Gilbert, N., Robertson, D. A., & Watts, C. J. (2021). Reproduction as a Means of Evaluating Policy Models: A Case Study of a COVID-19 Simulation. medRxiv 2021.01.29.21250743; DOI: https://doi.org/10.1101/2021.01.29.21250743

Dignum, F. (2020) Response to the review of Edmund Chattoe-Brown of the book “Social Simulations for a Crisis”. Review of Artificial Societies and Social Simulation, 4th Nov 2021. https://rofasss.org/2021/11/04/dignum-review-response/

Dignum, F. (Ed.) (2021) Social Simulation for a Crisis: Results and Lessons from Simulating the COVID-19 Crisis. Springer. DOI:10.1007/978-3-030-76397-8


Chattoe-Brown, E. (2021) Reply to Frank Dignum. Review of Artificial Societies and Social Simulation, 10th November 2021. https://rofasss.org/2021/11/10/reply-to-dignum/


© The authors under the Creative Commons’ Attribution-NoDerivs (CC BY-ND) Licence (v4.0)
Response to the review of Edmund Chattoe-Brown of the book “Social Simulations for a Crisis”

By Frank Dignum

This is a reply to a review in JASSS (Chattoe-Brown 2021) of (Dignum 2021).

Before responding to some of the specific concerns of Edmund I would like to thank him for the thorough review. I am especially happy with his conclusion that the book is solid enough to make it a valuable contribution to scientific progress in modelling crises. That was the main aim of the book and it seems that is achieved. I want to reiterate what we already remarked in the book; we do not claim that we have the best or only way of developing an Agent-Based Model (ABM) for crises. Nor do we claim that our simulations were without limitations. But we do think it is an extensive foundation from which others can start, either picking up some bits and pieces, deviating from it in specific ways or extending it in specific ways.

The concerns that are expressed by Edmund are certainly valid. I agree with some of them, but will nuance some others. First of all the concern about the fact that we seem to abandon the NetLogo implementation and move to Repast. This fact does not make the ABM itself any less valid! In itself it is also an important finding. It is not possible to scale such a complex model in NetLogo beyond around two thousand agents. This is not just a limitation of our particular implementation, but a more general limitation of the platform. It leads to the important challenge to get more computer scientists involved to develop platforms for social simulations that both support the modelers adequately and provide efficient and scalable implementations.

That the sheer size of the model and the results make it difficult to trace back the importance and validity of every factor on the results is completely true. We have tried our best to highlight the most important aspects every time. But, this leaves questions as to whether we make the right selection of highlighted aspects. As an illustration to this, we have been busy for two months to justify our results of the simulations of the effectiveness of the track and tracing apps. We basically concluded that we need much better integrated analysis tools in the simulation platform. NetLogo is geared towards creating one simulation scenario, running the simulation and analyzing the results based on a few parameters. This is no longer sufficient when we have a model with which we can create many scenarios and have many parameters that influence a result. We used R now to interpret the flood of data that was produced with every scenario. But, R is not really the most user friendly tool and also not specifically meant for analyzing the data from social simulations.

Let me jump to the third concern of Edmund and link it to the analysis of the results as well. While we tried to justify the results of our simulation on the effectiveness of the track and tracing app we compared our simulation with an epidemiological based model. This is described in chapter 12 of the book. Here we encountered the difference in assumed number of contacts per day a person has with other persons. One can take the results, as quoted by Edmund as well, of 8 or 13 from empirical work and use them in the model. However, the dispute is not about the number of contacts a person has per day, but what counts as a contact! For the COVID-19 simulations standing next to a person in the queue in a supermarket for five minutes can count as a contact, while such a contact is not a meaningful contact in the cited literature. Thus, we see that what we take as empirically validated numbers might not at all be the right ones for our purpose. We have tried to justify all the values of parameters and outcomes in the context for which the simulations were created. We have also done quite some sensitivity analyses, which we did not all report on just to keep the volume of the book to a reasonable size. Although we think we did a proper job in justifying all results, that does not mean that one can have different opinions on the value that some parameters should have. It would be very good to check the influence on the results of changes in these parameters. This would also progress scientific insights in the usefulness of complex models like the one we made!

I really think that an ABM crisis response should be institutional. That does not mean that one institution determines the best ABM, but rather that the ABM that is put forward by that institution is the result of a continuous debate among scientists working on ABM’s for that type of crisis. For us, one of the more important outcomes of the ASSOCC project is that we really need much better tools to support the types of simulations that are needed for a crisis situation. However, it is very difficult to develop these tools as a single group. A lot of the effort needed is not publishable and thus not valued in an academic environment. I really think that the efforts that have been put in platforms such as NetLogo and Repast are laudable. They have been made possible by some generous grants and institutional support. We argue that this continuous support is also needed in order to be well equipped for a next crisis. But we do not argue that an institution would by definition have the last word in which is the best ABM. In an ideal case it would accumulate all academic efforts as is done in the climate models, but even more restricted models would still be better than just having a thousand individuals all claiming to have a useable ABM while governments have to react quickly to a crisis.

The final concern of Edmund is about the empirical scale of our simulations. This is completely true! Given the scale and details of what we can incorporate we can only simulate some phenomena and certainly not everything around the COVID-19 crisis. We tried to be clear about this limitation. We had discussions about the Unity interface concerning this as well. It is in principle not very difficult to show people walking in the street, taking a car or a bus, etc. However, we decided to show a more abstract representation just to make clear that our model is not a complete model of a small town functioning in all aspects. We have very carefully chosen which scenarios we can realistically simulate and give some insights in reality from. Maybe we should also have discussed more explicitly all the scenarios that we did not run with the reasons why they would be difficult or unrealistic in our ABM. One never likes to discuss all the limitations of one’s labor, but it definitely can be very insightful. I have made up for this a little bit by submitting an to a special issue on predictions with ABM in which I explain in more detail, which should be the considerations to use a particular ABM to try to predict some state of affairs. Anyone interested to learn more about this can contact me.

To conclude this response to the review, I again express my gratitude for the good and thorough work done. The concerns that were raised are all very valuable to concern. What I tried to do in this response is to highlight that these concerns should be taken as a call to arms to put effort in social simulation platforms that give better support for creating simulations for a crisis.

References

Dignum, F. (Ed.) (2021) Social Simulation for a Crisis: Results and Lessons from Simulating the COVID-19 Crisis. Springer. DOI:10.1007/978-3-030-76397-8

Chattoe-Brown, E. (2021) A review of “Social Simulation for a Crisis: Results and Lessons from Simulating the COVID-19 Crisis”. Journal of Artificial Society and Social Simulation. 24(4). https://www.jasss.org/24/4/reviews/1.html


Dignum, F. (2020) Response to the review of Edmund Chattoe-Brown of the book “Social Simulations for a Crisis”. Review of Artificial Societies and Social Simulation, 4th Nov 2021. https://rofasss.org/2021/11/04/dignum-review-response/


© The authors under the Creative Commons’ Attribution-NoDerivs (CC BY-ND) Licence (v4.0)
The Systematic Comparison of Agent-Based Policy Models – It’s time we got our act together!

By Mike Bithell and Bruce Edmonds

Model Intercomparison

The recent Covid crisis has led to a surge of new model development and a renewed interest in the use of models as policy tools. While this is in some senses welcome, the sudden appearance of many new models presents a problem in terms of their assessment, the appropriateness of their application and reconciling any differences in outcome. Even if they appear similar, their underlying assumptions may differ, their initial data might not be the same, policy options may be applied in different ways, stochastic effects explored to a varying extent, and model outputs presented in any number of different forms. As a result, it can be unclear what aspects of variations in output between models are results of mechanistic, parameter or data differences. Any comparison between models is made tricky by differences in experimental design and selection of output measures.

If we wish to do better, we suggest that a more formal approach to making comparisons between models would be helpful. However, it appears that this is not commonly undertaken most fields in a systematic and persistent way, except for the field of climate change, and closely related fields such as pollution transport or economic impact modelling (although efforts are underway to extend such systematic comparison to ecosystem models –  Wei et al., 2014, Tittensor et al., 2018⁠). Examining the way in which this is done for climate models may therefore prove instructive.

Model Intercomparison Projects (MIP) in the Climate Community

Formal intercomparison of atmospheric models goes back at least to 1989 (Gates et al., 1999)⁠ with the first atmospheric model inter-comparison project (AMIP), initiated by the World Climate Research Programme. By 1999 this had contributions from all significant atmospheric modelling groups, providing standardised time-series of over 30 model variables for one particular historical decade of simulation, with a standard experimental setup. Comparisons of model mean values with available data helped to reveal overall model strengths and weaknesses: no single model was best at simulation of all aspects of the atmosphere, with accuracy varying greatly between simulations. The model outputs also formed a reference base for further inter-comparison experiments including targets for model improvement and reduction of systematic errors, as well as a starting point for improved experimental design, software and data management standards and protocols for communication and model intercomparison. This led to AMIPII and, subsequently, to a series of Climate model inter-comparison projects (CMIP) beginning with CMIP I in 1996. The latest iteration (CMIP 6) is a collection of 23 separate model intercomparison experiments covering atmosphere, ocean, land surface, geo-engineering, and the paleoclimate. This collection is aimed at the upcoming 2021 IPCC process (AR6). Participating projects go through an endorsement process for inclusion, (a process agreed with modelling groups), based on 10 criteria designed to ensure some degree of coherence between the various models – a further 18 MIPS are also listed as currently active (https://www.wcrp-climate.org/wgcm-cmip/wgcm-cmip6). Groups contribute to a central set of common experiments covering the period 1850 to the near-present. An overview of the whole process can be found in (Eyring et al., 2016).

The current structure includes a set of three overarching questions covering the dynamics of the earth system, model systematic biases and understanding possible future change under uncertainty. Individual MIPS may build on this to address one or more of a set of 7 “grand science challenges” associated with the climate. Modelling groups agree to provide outputs in a standard form, obtained from a specified set of experiments under the same design, and to provide standardised documentation to go with their models. Originally (up to CMIP 5), outputs were then added to a central public repository for further analysis, however the output grew so large under CMIP6 that now the data is held dispersed over repositories maintained by separate groups.

Other Examples

Two further more recent examples of collective model  development may also be helpful to consider.

Firstly, an informal network collating models across more than 50 research groups has already been generated as a result of the COVID crisis –  the Covid Forecast Hub (https://covid19forecasthub.org). This is run by a small number of research groups collaborating with the US Centre for Disease Control and is strongly focussed on the epidemiology. Participants are encouraged to submit weekly forecasts, and these are integrated into a data repository and can be vizualized on the website – viewers can look at forward projections, along with associated confidence intervals and model evaluation scores, including those for an ensemble of all models. The focus on forecasts in this case arises out of the strong policy drivers for the current crisis, but the main point is that it is possible to immediately view measures of model performance and to compare the different model types: one clear message that rapidly becomes apparent is that many of the forward projections have 95% (and at some times, even 50%) confidence intervals for incident deaths that more than span the full range of the past historic data. The benefit of comparing many different models in this case is apparent, as many of the historic single-model projections diverge strongly from the data (and the models most in error are not consistently the same ones over time), although the ensemble mean tends to be better.

As a second example, one could consider the Psychological Science Accelerator (PSA: Moshontz et al 2018, https://psysciacc.org/). This is a collaborative network set up with the aim of addressing the “replication crisis” in psychology: many previously published results in psychology have proved problematic to replicate as a result of small or non-representative sampling or use of experimental designs that do not generalize well or have not been used consistently either within or across studies. The PSA seeks to ensure accumulation of reliable and generalizable evidence in psychological science, based on principles of inclusion, decentralization, openness, transparency and rigour. The existence of this network has, for example, enabled the reinvestigation of previous  experiments but with much larger and less nationally biased samples (e.g. Jones et al 2021).

The Benefits of the Intercomparison Exercises and Collaborative Model Building

More specifically, long-term intercomparison projects help to do the following.

  • Build on past effort. Rather than modellers re-inventing the wheel (or building a new framework) with each new model project, libraries of well-tested and documented models, with data archives, including code and experimental design, would allow researchers to more efficiently work on new problems, building on previous coding effort
  • Aid replication. Focussed long term intercomparison projects centred on model results with consistent standardised data formats would allow new versions of code to be quickly tested against historical archives to check whether expected results could be recovered and where differences might arise, particularly if different modelling languages were being used
  • Help to formalize. While informal code archives can help to illustrate the methods or theoretical foundations of a model, intercomparison projects help to understand which kinds of formal model might be good for particular applications, and which can be expected to produce helpful results for given desired output measures
  • Build credibility. A continuously updated set of model implementations and assessment of their areas of competence and lack thereof (as compared with available datasets) would help to demonstrate the usefulness (or otherwise) of ABM as a way to represent social systems
  • Influence Policy (where appropriate). Formal international policy organisations such as the IPCC or the more recently formed IPBES are effective partly through an underpinning of well tested and consistently updated models. As yet it is difficult to see whether such a body would be appropriate or effective for social systems, as we lack the background of demonstrable accumulated and well tested model results.

Lessons for ABM?

What might we be able to learn from the above, if we attempted to use a similar process to compare ABM policy models?

In the first place, the projects started small and grew over time: it would not be necessary, for example, to cover all possible ABM applications at the outset. On the other hand, the latest CMIP iterations include a wide range of different types of model covering many different aspects of the earth system, so that the breadth of possible model types need not be seen as a barrier.

Secondly, the climate inter-comparison project has been persistent for some 30 years – over this time many models have come and gone, but the history of inter-comparisons allows for an overview of how well these models have performed over time – data from the original AMIP I models is still available on request, supporting assessments concerning  long-term model improvement.

Thirdly, although climate models are complex – implementing a variety of different mechanisms in different ways – they can still be compared by use of standardised outputs, and at least some (although not necessarily all) have been capable of direct comparison with empirical data.

Finally, an agreed experimental design and public archive for documentation and output that is stable over time is needed; this needs to be done via a collective agreement among the modelling groups involved so as to ensure a long-term buy-in from the community as a whole, so that there is a consistent basis for long-term model development, building on past experience.

The need for aligning or reproducing ABMs has long been recognised within the community (Axtell et al. 1996; Edmonds & Hales 2003), but on a one-one basis for verifying the specification of models against their implementation, although (Hales et al. 2003) discusses a range of possibilities. However, this is far from a situation where many different models of basically the same phenomena are systematically compared – this would be a larger scale collaboration lasting over a longer time span.

The community has already established a standardised form of documentation in the ODD protocol. Sharing of model code is also becoming routine, and can be easily achieved through COMSES, Github or similar. The sharing of data in a long-term archive may require more investigation. As a starting project COVID-19 provides an ideal opportunity for setting up such a model inter-comparison project – multiple groups already have running examples, and a shared set of outputs and experiments should be straightforward to agree on. This would potentially form a basis for forward looking experiments designed to assist with possible future pandemic problems, and a basis on which to build further features into the existing disease-focussed modelling, such as the effects of economic, social and psychological issues.

Additional Challenges for ABMs of Social Phenomena

Nobody supposes that modelling social phenomena is going to have the same set of challenges that climate change models face. Some of the differences include:

  • The availability of good data. Social science is bedevilled by a paucity of the right kind of data. Although an increasing amount of relevant data is being produced, there are commercial, ethical and data protection barriers to accessing it and the data rarely concerns the same set of actors or events.
  • The understanding of micro-level behaviour. Whilst the micro-level understanding of our atmosphere is very well established, those of the behaviour of the most important actors (humans) is not. However, it may be that better data might partially substitute for a generic behavioural model of decision-making.
  • Agreement upon the goals of modelling. Although there will always be considerable variation in terms of what is wanted from a model of any particular social phenomena, a common core of agreed objectives will help focus any comparison and give confidence via ensembles of projections. Although the MIPs and Covid Forecast Hub are focussed on prediction, it may be that empirical explanation may be more important in other areas.
  • The available resources. ABM projects tend to be add-ons to larger endeavours and based around short-term grant funding. The funding for big ABM projects is yet to be established, not having the equivalent of weather forecasting to piggy-back on.
  • Persistence of modelling teams/projects. ABM tends to be quite short-term with each project developing a new model for a new project. This has made it hard to keep good modelling teams together.
  • Deep uncertainty. Whilst the set of possible factors and processes involved in a climate change model are well established, which social mechanisms need to be involved in any model of any particular social phenomena is unknown. For this reason, there is deep disagreement about the assumptions to be made in such models, as well as sharp divergence in outcome due to changes brought about by a particular mechanism but not included in a model. Whilst uncertainty in known mechanisms can be quantified, assessing the impact of those due to such deep uncertainty is much harder.
  • The sensitivity of the political context. Even in the case of Climate Change, where the assumptions made are relatively well understood and done on objective bases, the modelling exercise and its outcomes can be politically contested. In other areas, where the representation of people’s behaviour might be key to model outcomes, this will need even more care (Adoha & Edmonds 2017).

However, some of these problems were solved in the case of Climate Change as a result of the CMIP exercises and the reports they ultimately resulted in. Over time the development of the models also allowed for a broadening and updating of modelling goals, starting from a relatively narrow initial set of experiments. Ensuring the persistence of individual modelling teams is easier in the context of an internationally recognised comparison project, because resources may be easier to obtain, and there is a consistent central focus. The modelling projects became longer-term as individual researchers could establish a career doing just climate change modelling and importance of the work increasingly recognised. An ABM modelling comparison project might help solve some of these problems as the importance of its work is established.

Towards an Initial Proposal

The topic chosen for this project should be something where there: (a) is enough public interest to justify the effort, (b) there are a number of models with a similar purpose in mind being developed.  At the current stage, this suggests dynamic models of COVID spread, but there are other possibilities, including: transport models (where people go and who they meet) or criminological models (where and when crimes happen).

Whichever ensemble of models is focussed upon, these models should be compared on a core of standard, with the same:

  • Start and end dates (but not necessarily the same temporal granularity)
  • Covering the same set of regions or cases
  • Using the same population data (though possibly enhanced with extra data and maybe scaled population sizes)
  • With the same initial conditions in terms of the population
  • Outputting a core of agreed measures (but maybe others as well)
  • Checked against their agreement against a core set of cases, with agreed data sets
  • Reported on in a standard format (though with a discussion section for further/other observations)
  • well documented and with code that is open access
  • Run a minimum of times with different random seeds

Any modeller/team that had a suitable model and was willing to adhere to the rules would be welcome to participate (commercial, government or academic) and these teams would collectively decide the rules, development and write any reports on the comparisons. Other interested stakeholder groups could be involved including professional/academic associations, NGOs and government departments but in a consultative role providing wider critique – it is important that the terms and reports from the exercise be independent or any particular interest or authority.

Conclusion

We call upon those who think ABMs have the potential to usefully inform policy decisions to work together, in order that the transparency and rigour of our modelling matches our ambition. Whilst model comparison exercises of the kind described are important for any simulation work, particular care needs to be taken when the outcomes can affect people’s lives.

References

Aodha, L. & Edmonds, B. (2017) Some pitfalls to beware when applying models to issues of policy relevance. In Edmonds, B. & Meyer, R. (eds.) Simulating Social Complexity – a handbook, 2nd edition. Springer, 801-822. (A version is at http://cfpm.org/discussionpapers/236)

Axtell, R., Axelrod, R., Epstein, J. M., & Cohen, M. D. (1996). Aligning simulation models: A case study and results. Computational & Mathematical Organization Theory, 1(2), 123-141. https://link.springer.com/article/10.1007%2FBF01299065

Edmonds, B., & Hales, D. (2003). Replication, replication and replication: Some hard lessons from model alignment. Journal of Artificial Societies and Social Simulation, 6(4), 11. http://jasss.soc.surrey.ac.uk/6/4/11.html

Eyring, V., Bony, S., Meehl, G. A., Senior, C. A., Stevens, B., Stouffer, R. J., & Taylor, K. E. (2016). Overview of the Coupled Model Intercomparison Project Phase 6 (CMIP6) experimental design and organization. Geoscientific Model Development, 9(5), 1937–1958. https://doi.org/10.5194/gmd-9-1937-2016

Gates, W. L., Boyle, J. S., Covey, C., Dease, C. G., Doutriaux, C. M., Drach, R. S., Fiorino, M., Gleckler, P. J., Hnilo, J. J., Marlais, S. M., Phillips, T. J., Potter, G. L., Santer, B. D., Sperber, K. R., Taylor, K. E., & Williams, D. N. (1999). An Overview of the Results of the Atmospheric Model Intercomparison Project (AMIP I). In Bulletin of the American Meteorological Society (Vol. 80, Issue 1, pp. 29–55). American Meteorological Society. https://doi.org/10.1175/1520-0477(1999)080<0029:AOOTRO>2.0.CO;2

Hales, D., Rouchier, J., & Edmonds, B. (2003). Model-to-model analysis. Journal of Artificial Societies and Social Simulation, 6(4), 5. http://jasss.soc.surrey.ac.uk/6/4/5.html

Jones, B.C., DeBruine, L.M., Flake, J.K. et al. To which world regions does the valence–dominance model of social perception apply?. Nat Hum Behav 5, 159–169 (2021). https://doi.org/10.1038/s41562-020-01007-2

Moshontz, H. + 85 others (2018) The Psychological Science Accelerator: Advancing Psychology Through a Distributed Collaborative Network ,  1(4) 501-515. https://doi.org/10.1177/2515245918797607

Tittensor, D. P., Eddy, T. D., Lotze, H. K., Galbraith, E. D., Cheung, W., Barange, M., Blanchard, J. L., Bopp, L., Bryndum-Buchholz, A., Büchner, M., Bulman, C., Carozza, D. A., Christensen, V., Coll, M., Dunne, J. P., Fernandes, J. A., Fulton, E. A., Hobday, A. J., Huber, V., … Walker, N. D. (2018). A protocol for the intercomparison of marine fishery and ecosystem models: Fish-MIP v1.0. Geoscientific Model Development, 11(4), 1421–1442. https://doi.org/10.5194/gmd-11-1421-2018

Wei, Y., Liu, S., Huntzinger, D. N., Michalak, A. M., Viovy, N., Post, W. M., Schwalm, C. R., Schaefer, K., Jacobson, A. R., Lu, C., Tian, H., Ricciuto, D. M., Cook, R. B., Mao, J., & Shi, X. (2014). The north american carbon program multi-scale synthesis and terrestrial model intercomparison project – Part 2: Environmental driver data. Geoscientific Model Development, 7(6), 2875–2893. https://doi.org/10.5194/gmd-7-2875-2014


Bithell, M. and Edmonds, B. (2020) The Systematic Comparison of Agent-Based Policy Models - It’s time we got our act together!. Review of Artificial Societies and Social Simulation, 11th May 2021. https://rofasss.org/2021/05/11/SystComp/


Should the family size be used in COVID-19 vaccine prioritization strategy to prevent variants diffusion? A first investigation using a basic ABM

By Gianfranco Giulioni

Department of Philosophical, Pedagogical and Economic-Quantitative Sciences, University of Chieti-Pescara, Italy

(A contribution to the: JASSS-Covid19-Thread)

When writing this document, few countries have made significant progress in vaccinating their population while many others still move first steps.

Despite the importance of COVID-19 adverse effects on society, there seems to be too little debate on the best option for progressing the vaccination process after the front-line healthcare personnel has been immunized.

The overall adopted strategies in the front-runner countries prioritize people using their health fragility, and age. For example, this strategy’s effectiveness is supported by Bubar et al. (2021), who provide results based on a detailed age-stratified Susceptible, Exposed, Infectious, Recovered (SEIR) model.

During the Covid infection outbreak, the importance of families in COVID diffusion was stressed by experts and media. This observation motivates the present effort, which investigates if considering family size among the vaccine prioritization strategy can have a role.

This document describes an ABM model developed with the intent of analyzing the question. The model is basic and has the essentials features to investigate the issue.

As highlighted by Squazzoni et al. (2020) a careful investigation of pandemics requires the cooperation of many scientists from different disciplines. To ease this cooperation and to the aim of transparency (Barton et al. 2020), the code is made publicly available to allow further developments and accurate parameters calibration to those who might be interested. (https://github.com/gfgprojects/abseir_family)

The following part of the document will sketch the model functioning and provide some considerations on families’ effects on vaccination strategy.

Brief Model Description

The ABSEIR-family model code is written in Java, taking advantage of the Repast Simphony modeling system (https://repast.github.io/).

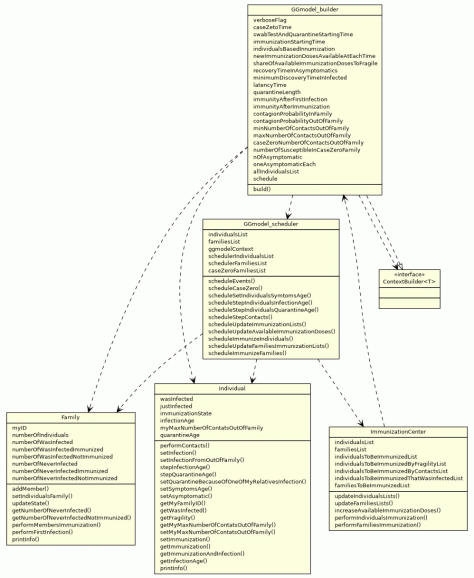
Figure 1 gives an overview of the current development state of the model core classes.

Briefly, the code handles the relevant events of a pandemic:

  • the appearance of the first case,
  • the infection diffusion by contacts,
  • the introduction of measures for diffusion limitation such as quarantine,
  • the activation and implementation of the immunization process.

The distinguishing feature of the model is that individuals are grouped in families. This grouping allows considering two different diffusion speeds: fast among family members and slower when contacts involve two individuals from different families.

Figure 1: relationships between the core classes of the ABSEIR-family model and their variables and methods.

It is perhaps worth describing the evolution of an individual state to sketch the functioning of the model.

An individual’s dynamic is guided by a variable named infectionAge. In the beginning, all the individuals have this variable at zero. The program increases the infectionAge of all the individuals having a non zero value of this variable at each time step.

When an individual has contact with an infectious, s/he can get the infection or not. If infected, the individual enters the latency period, i.e. her/his infectionAge is set to 1 and the variable starts moving ahead with time, but s/he is not infectious. Individuals whose infectionAge is greater than the latency period length (ll ) become infectious.

At each time step, an infectious meets all her/his family members and mof randomly chosen non-family members. S/he passes on the infection with probability pif to family members and pof to non-family members. The infection can be passed on only if the contacted individual’s infectionAge equals zero and if s/he is not in quarantine.

The infectious phase ends when the infection is discovered (quarantine) or when the individual recovers i.e., the infectionAge is greater than the latency period length plus the infection length parameter (li).

At the present stage of development, the code does not handle the virus adverse post-infection evolution. All the infected individuals in this model recover. The infectionAge is set at a negative value at recovery because recovereds stay immune for a while (lr). Similarly, vaccination set the individual’s  infectionAge to a (high) negative value (lv).

At the present state of the pandemic evolution it is perhaps useful to use the model to get insights into how the family size could affect the vaccination process’s effectiveness. This will be attempted hereafter.

Highlighting the relevance of families size by an ad-hoc example

The relevance of family size in vaccination strategy can be shown using the following ad-hoc example.

Suppose there are two covid-free villages (say village A and B) whose health authorities are about to start vaccinations to avoid the disease spreading.

Villages are identical in the other aspects except for the family size distribution. Each village has 50 inhabitants, but village A has 10 families with five components each, while village B has two five members families and 40 singletons. Five vaccines arrive each day in each village.

Some additional extreme assumptions are made to make differences straightforward.

First, healthy family members are infected for sure by a member who contracted the virus. Second, each individual has the same number of contacts (say n) outside the family and the probability to pass  on the virus in external contacts is lower than 1. Symptoms take several days before showing up.

Now, the health authority are about to start the vaccination process and has to decide how to employ the available vaccines.

Intuition would suggest that Village B’s health authority should immunize large families first. Indeed, if case zero arrives at the end of the second vaccination day, the spread of the disease among the population should be limited because the virus can be passed on by external contacts only; and the probability of transmitting the virus in external contacts is lower than in the family.

But, should this strategy be used even by village A health authority?

To answer this question, we compare the family-based vaccination strategy with a random-based vaccination strategy. In a random-based vaccination strategy, we expect one members to be immunized in each family at the end of the second vaccination day. In the family-based vaccination strategy, two families are immunized at the end of the second vaccination day. Now, suppose one of the not-immunized citizens gets the virus at the end of day two. It is easy to verify there will be an infected more in the family-based strategy (all the five components of the family) than in the random-based strategy (4 components because one of them was immunized before). Furthermore, this implies that there will be n additional dangerous external contacts in the family-based strategy than in the random-based strategy.

These observations make us conclude that a random vaccination strategy will slow down the infection dynamics in village A while it will speed up infections in village B, and the opposite is true for the family-based immunization strategy.

Some simulation exercises

In this part of the document, the model described above will be used to compare further the family-based and random-based vaccination strategy to be used against the appearance of a new case (or variant) in a situation similar to that described in the example but with a more realistic setting.

As one can easily imagine, the family size distribution and COVID transmission risk in families are crucial to our simulation exercises. It is therefore important to gather real-world information for these phenomena. Fortunately, recent scientific contributions can help.

Several authors point out that a Poisson distribution is a good statistical model representing the family size distribution. This distribution is suitable because a single parameter characterizes it, i.e., its average, but it has the drawback of having a positive probability for zero value. Recently, Jarosz (2020) confirms the Poisson distribution’s goodness for modeling family size and shows how shifting it by one unit would be a valid alternative to solve the zero family size problem.

Furthermore, average family sizes data can be easily found using, for example, the OECD family database (http://www.oecd.org/social/family/database.htm).

The current version of the database (updated on 06-12-2016) presents data for 2015 with some exceptions. It shows how the average size of families in OECD countries is 2.46, ranging from Mexico (3.93) to Sweden (1.8).

The result in Metlay et al. (2021) guides the choice of the infection in the family parameter. They  provide evidence of an overall household infection risk of 10.1%

Simulation exercises consist in parameters sensitivity analysis with respect to the benchmark parameter set reported hereafter.

The simulation initialization is done by loading the family size distribution. Two alternative distributions are used and are tuned to obtain a system with a total number of individuals close to 20000. The two distributions are characterized by different average family sizes (afs) and are shown in figure 2.

Figure 2: two family size distributions used to initialize the simulation. Figures by the dots inform on the frequency of the corresponding size. Black square relates to the distribution with an average of 2.5; red circles relate to the distribution with an average of 3.5

The description of the vaccination strategy gives a possibility to list other relevant parameters. The immunization center is endowed with nv doses of vaccine at each time starting from time tv. At time t0, the state of one of the individuals is changed from susceptible to infected. This subject (case zero) is taken from a family having three susceptibles among their components.

Case zero undergoes the same process as all other following infected individuals described above.

The relevant parameters of the simulations are reported in table 1.

var description values reference
ni number of individuals ≅20000
afs average family size 2.5;3.5 OECD
nv number of vaccine doses available at each time 50;100;150
tv vaccination starting time 1
t0 case zero appearance time 10
ll length of latency 3 Buran et al 2021
li length of infectious period 5 Buran et al 2021
pif probability to infect a family member 0.1 Metlay et al 2021
pof probability to infect a non-family individual 0.01;0.02;0.03
mof number of non-family contacts of an infectious 10

Table 1: relevant parameters of the model.

We are now going to discuss the results of our simulation exercises. We focus particularly on the number of people infected up to a given point in time.

Due to the presence of random elements, each run has a different trajectory. We limit these effects as much as possible to allow ceteris paribus comparisons. For example, we keep the family size distribution equal across runs by loading the distributions displayed in figure 2 instead of using the run-time random number generator. Again, we set the number of non-family contacts (mof) equal for all the agents, although the code could set it randomly at each time step. Despite these randomness reductions, significant differences in the dynamics remain within the same parametrization because of randomness in the network of contacts.

To allow comparisons among different parametrizations in the presence of different evolution, we use the cross-section distributions of the total number of infected at the end of the infection process (i.e. time 200).

Figure 3 reports the empirical cumulative distribution function (ecdf) of several parametrizations. To easily read the figure, we put the different charts as in a plane having the average family size (afs) in the abscissa and the number of available vaccines (nv) in the ordinate. From above, we know two values of afs (i.e. 2.5 and 3.5) and three values of nv (i.e. 50, 100 and 150) are considered. Therefore figure 3 is made up of 6 charts.

Each chart reports ecdfs corresponding to the three different pof levels reported in table 1. In particular, circles denote edcfs for pof = 0.01, squares are for  pof = 0.02 and triangles for  pof = 0.03. At the end, choosing a parameters values triplet (afs, nv, pof), two ecdfs are identified. The red one is for the random-based, while the black one is for the family-based vaccination strategy. The family based vaccination strategy prioritizes families with higher number of members not yet infected.

Figure 3 shows mixed results: the random-based vaccination strategy outperforms the family-based one (the red line is above the balck one) for some parameters combinations while the reverse holds for others. In particular, the random-based tends to dominate the family-based strategy in case of larger family (afs = 3.5) and low and high vaccination levels (nv = 50 and 150). The opposite is true with smaller families at the same vaccination levels. The intermediate level of vaccination provides exceptions.

Figure 3: empirical cumulative distribution function of several parametrizations. The ecdfs is build by taking the number of infected people at period 200 of 100 runs with different random seed for each parametrization.

It is perhaps useful to highlight how, in the model, the family-based vaccination strategy stops the diffusion of a new wave or variant with a significant probability for smaller average family size and low and high vaccination levels (bottom-left and top-left charts) and for large average family size and middle level of vaccination (middle-right chart).

A conclusive note

At present, the model is very simple and can be improved in several directions. The most useful would probably be the inclusion of family-specific information. Setting up the model with additional information on each family member’s age or health state would allow overcoming the “universal mixing assumption” (Watts et al., 2020) currently in the model. Furthermore, additional vaccination strategy prioritization based on multiple criteria (such as vaccinating the families of most fragile or elderly) could be compared.

Initializing the model with census data of a local community could give a chance to analyze a more realistic setting in the wake of Pescarmona et al. (2020) and be more useful and understandable to (local) policy makers (Edmonds, 2020).

Developing the model to provide estimations for hospitalization and mortality is another needed step towards more sound vaccination strategies comparison.

Vaccinating by families could balance direct (vaccinating highest risk individuals) and indirect protection, i.e., limiting the probability the virus reaches most fragiles by vaccinating people with many contacts. It could also have positive economic effects relaunching, for example, family tourism. However, it cannot be implemented at risk of worsening the pandemic.

The present text aims only at posing a question. Further assessments following Squazzoni et al.’s (2020) recommendations are needed.

References

Barton, C.M. et al. (2020) Call for transparency of COVID-19 models. Science, 368(6490), 482-483. doi:10.1126/science.abb8637

Bubar, K.M. et al. (2021) Model-informed COVID-19 vaccine prioritization strategies by age and serostatus. Science 371, 916–921. doi:10.1126/science.abe6959

Edmonds, B. (2020) What more is needed for truly democratically accountable modelling? Review of Artificial Societies and Social Simulation, 2nd May 2020. https://rofasss.org/2020/05/02/democratically-accountable-modelling/

Jarosz, B. (2021) Poisson Distribution: A Model for Estimating Households by Household Size. Population Research and Policy Review, 40, 149–162. doi:10.1007/s11113-020-09575-x

Metlay J.P., Haas J.S., Soltoff A.E., Armstrong KA. Household Transmission of SARS-CoV-2. (2021) JAMA Netw Open, 4(2):e210304. doi:10.1001/jamanetworkopen.2021.0304

Pescarmona, G., Terna, P., Acquadro, A., Pescarmona, P., Russo, G., and Terna, S. (2020) How Can ABM Models Become Part of the Policy-Making Process in Times of Emergencies – The S.I.S.A.R. Epidemic Model. Review of Artificial Societies and Social Simulation, 20th Oct 2020. https://rofasss.org/2020/10/20/sisar/

Watts, C.J., Gilbert, N., Robertson, D., Droy, L.T., Ladley, D and Chattoe-Brown, E. (2020) The role of population scale in compartmental models of COVID-19 transmission. Review of Artificial Societies and Social Simulation, 14th August 2020. https://rofasss.org/2020/08/14/role-population-scale/

Squazzoni, F., Polhill, J. G., Edmonds, B., Ahrweiler, P., Antosz, P., Scholz, G., Chappin, É., Borit, M., Verhagen, H., Giardini, F. and Gilbert, N. (2020) Computational Models That Matter During a Global Pandemic Outbreak: A Call to Action. Journal of Artificial Societies and Social Simulation, 23(2):10. <http://jasss.soc.surrey.ac.uk/23/2/10.html>. doi: 10.18564/jasss.4298


Giulioni, G. (2020) Should the family size be used in COVID-19 vaccine prioritization strategy to prevent variants diffusion? A first investigation using a basic ABM. Review of Artificial Societies and Social Simulation, 15th April 2021. https://rofasss.org/2021/04/15/famsize/


How Can ABM Models Become Part of the Policy-Making Process in Times of Emergencies – The S.I.S.A.R. Epidemic Model

By Gianpiero Pescarmona1, Pietro Terna2,*, Alberto Acquadro1, Paolo Pescarmona3, Giuseppe Russo4, and Stefano Terna5

*Corresponding author, 1University of Torino, IT, 2University of Torino, IT, retired & Collegio Carlo Alberto, IT, 3University of Groningen, NL, 4Centro Einaudi, Torino, IT, 5tomorrowdata.io

(A contribution to the: JASSS-Covid19-Thread)

We propose an agent-based model to simulate the Covid-19 epidemic diffusion, with Susceptible, Infected, symptomatic, asymptomatic, and Recovered people: hence the name S.I.s.a.R. The scheme comes from S.I.R. models, with (i) infected agents categorized as symptomatic and asymptomatic and (ii) the places of contagion specified in a detailed way, thanks to agent-based modeling capabilities. The infection transmission is related to three factors: the infected person’s characteristics and the susceptible one, plus those of the space in which contact occurs. The asset of the model is the development of a tool that allows analyzing the contagions’ sequences in simulated epidemics and identifying the places where they occur.

The characteristics of the S.I.s.a.R. model

S.I.s.a.R. can be found at https://terna.to.it/simul/SIsaR.html with information on model construction, the draft of a paper also reporting results, and an online executable version of the simulation program, built using NetLogo. The model includes the structural data of Piedmont, an Italian region, but it can be readily calibrated for other areas. The model reproduces a realistic calendar (e.g., national or local government decisions), via a dedicated script interpreter.

Why another model? The starting point has been the need to model the pandemic problem in a multi-scale way. This was initiated a few months before the publication of new frontier articles, such as Bellomo et al. (2020), so when equation-based S.I.R. models, with their different versions, were predominating.

As any model, also this one is based on some assumptions: time will tell whether these were reasonable hypotheses. Modeling the Covid-19 pandemic requires a scenario and the actors. As in a theatre play, the author defines the roles of the actors and the environment. The characters are not real, they are pre-built by the author, and they act according to their peculiar constraints. If the play is successful, it will run for a long time, even centuries. If not, we will rapidly forget it. Shakespeare’s Hamlet is still playing after centuries, even if the characters and the plot are entirely imaginary. The same holds for our simulations: we are the authors, we arbitrarily define the characters, we force them to act again and again in different scenarios. However, in our model, the micro-micro assumptions are not arbitrary but based on scientific hypotheses at the molecular level, the micro agents’ behaviors are modeled in an explicit and realistic way. In both plays and simulations, we compress the time: a whole life to 2 or 3 hours on the stage. In a few seconds, we run the Covid-19 pandemic spread in a given regional area.

With our model, we move from a macro compartmental vision to a meso and microanalysis capability. Its main characteristics are:

  • scalability: we take in account the interactions between virus and molecules inside the host, the interactions between individuals in more or less restricted contexts, the movement between different environments (home, school, workplace, open spaces, shops, in a second version, we will add transportations and long trips between regions/countries; discotheques; other social aggregation events, as football matches); the movements occur in different parts of the daily life, as in Ghorbani et al. (2020);

the scales are:

    • micro, with the internal biochemical mechanism involved in reacting to the virus, as in Silvagno et al. (2020), from where we derive the critical importance assigned to an individual intrinsic susceptibility related to the age and previous morbidity episodes; the model incorporates the medical insights of one of its co-authors, former full professor of clinical biochemistry, signing also the quoted article; a comment on Lancet (Horton, 2020) consistently signals the syndemic character of the current event: «Two categories of disease are interacting within specific populations—infection with severe acute respiratory syndrome coronavirus 2 (SARS-CoV-2) and an array of non-communicable diseases (NCDs)»;
    • meso, with the open and closed contexts where the agents behave, as reported above;
    • macro, with the emergent effects of the actions of the agents; this final analysis is a premise to evaluate the costs and benefits of the different intervention policies;
  • granularity: at any level, the interactions are partially random and therefore the final results always reflect the sum of the randomness at the different levels; changing the constraints at different levels and running multiple simulations should allow the identification of the most critical points, i.e., those on which the intervention should be focused.

Contagion sequences as a source of suggestions for intervention policies

All the previous considerations are not exhaustive. The critical point that makes helpful the production of a new model is creating a tool that allows analyzing the contagions’ sequences in simulated epidemics and identifying the places where they occur. We represent each infecting agent as a horizontal segment with a vertical connection to another agent receiving the infection. We represent the second agent via a further segment at an upper layer. With colors, line thickness, and styles, we display multiple data.

As an example, look at Fig.4: we start with two agents coming from the outside, with black as color code (external place), the first one–regular, as reported by the thickness of the segment, starting at day 0 and finishing at day 22–is asymptomatic (dashed line) and infects five agents; the second one–robust, as reported by the thickness of the segment, starting at day 0 and finishing at day 15–is asymptomatic (dashed line) and infects no one; the first of the five infected agents received the infection at home (cyan color) and turns to be asymptomatic after a few days of incubation (dotted line), and so on. Solid lines identify symptomatic agents; brown color refers to workplaces, orange to nursing homes; yellow to schools; pink to hospitals; gray to open spaces. Thick or extra-thick lines refer to fragile or extra-fragile agents, respectively.

This technique enables understanding at a glance how an epidemic episode is developing. In this way, it is easier to reason about countermeasures and, thus, to develop intervention policies. In Figs. 1-4, we can look both at the places where contagions occur and at the dynamics emerging with different levels of intervention. In Fig. 1 we find evidence of the role of the workplaces in diffusing the infection, with a relevant number of infected fragile workers. In Fig. 2, by isolating fragile workers at home, the epidemics seems to finish, but in Fig. 3, we see a thin event (a single case of contagion) that creates a bridge toward a second wave. Finally, in Fig. 4, we see that the epidemic is under control by isolating the workers and any kind of fragile agents. (Please enlarge the on-screen images to see more details).

A scatter graph showing an epidemic with regular containment measures, showing a highly significant effect of workplaces (brown)Figure 1 – An epidemic with regular containment measures, showing a highly significant effect of workplaces (brown)

A scatter graph showing The effects of stopping fragile workers at day 20, with a positive result, but home contagions (cyan) keep alive the pandemic, exploding again in workplaces (brown)

Figure 2 – The effects of stopping fragile workers at day 20, with a positive result, but home contagions (cyan) keep alive the pandemic, exploding again in workplaces (brown)

A scatter graph showing The effects of stopping fragile workers at day 20, with a positive result, but home contagions (cyan) keep alive the pandemic, exploding again in workplaces (brown)

Figure 3 – Same, analyzing the first 200 infections with evidence of the event around day 110 with the new phase due to a unique asymptomatic worker

A scatter graph showing the impoaact of Stopping fragile workers plus any case of fragility at day 15, also isolating nursing homes

Figure 4 – Stopping fragile workers plus any case of fragility at day 15, also isolating nursing homes

Batches of simulation runs

The sequence in the steps described by the four figures is only a snapshot, a suggestion. We need to explore systematically the introduction of factual, counterfactual, and prospective interventions to control the spread of the contagions. Each simulation run–whose length coincides with the disappearance of symptomatic or asymptomatic contagion cases–is a datum in a wide scenario of variability in time and effects. Consequently, we need to represent compactly the results emerging from batches of repetitions, to compare the consequences of each batch’s basic assumptions.

For this purpose, we used blocks of one thousand repetitions. Besides summarizing the results with the usual statistical indicators, we adopted the technique of the heat-maps. In this perspective, with Steinmann et al. (2020), we developed a tool for comparative analyses, not for forecasting. This consideration is consistent with the enormous standard deviation values that are intrinsic to the problem.

Figs. 5-6 provide two heat-maps reporting the duration of each simulated epidemic in the x axis and the number of the symptomatic, asymptomatic, and deceased agents in the y axis. 1,000 runs in both cases.

The actual data for Piedmont, where the curve of the contagions flattened with the end of May, with around 30 thousand subjects, is included in the cell in the first row, immediately to the right of the mode in Fig. 6. In the Fall, a second wave seems possible, jumping into one of the events of the range of events on the right side of the same figure.

Figure 5 – 1000 Epidemics without containment measures (2D histogram of (Symptomatic+Asymptomatic+Deceased against days)

Figure 6 – 1000 Epidemics with basic non-pharmaceutical containment measures, no school in September 2020 (2D histogram of (Symptomatic+Asymptomatic+Deceased against days)

In Table 1 we have a set of statistical indicators related to 1,000 runs of the simulation with the different initial conditions. Cases 1 and 2 are those of Fig. 5 and 6. Then we introduce Case 4, excluding from the workplace workers with health fragilities, so highly susceptible to contagion, with smart work when possible or sick pay conditions. The gain in the reduction of affected people and duration is relevant and increases – in Case 5 – if we leave at home all kinds of fragile people.

Scenarios Total symptomatic Total symptomatic, asymptomatic, deceased Days
1. no control 851.12
(288.52)
2253.48
(767.58)
340.10
(110.21)
2. basic controls, no school in Sep 2020 158.55
(174.10)
416.98
(462.94)
196.97
(131.18)
4. basic controls, stop fragile workers, no schools in Sep 2020 120.17
(149.10)
334.68
(413.90)
181.10
(125.46)
5. basic controls, stop fragile workers & fragile people, nursing-homes isolation, no schools in Sep 2020 105.63
(134.80)
302.62
(382.14)
174.39
(12.82)
7. basic controls, stop f. workers & fragile people, nursing-homes isolation, open factories, schools in Sep 2020 116.55
(130.91)
374.68
(394.66)
195.28
(119.33)

Table 1 – Statistical indicators, limited to the mean and to the standard deviation, reported in parentheses, for a set of experiments; the row numbers are consistent with the paper at https://terna.to.it/simul/SIsaR.html where we report a larger number of simulation experiments

In Case 7, we show that keeping the conditions of Case 5, while opening schools and factories (work places in general), increases in a limited way the adverse events.

A second version

A second version of the model is under development, using https://terna.github.io/SLAPP/, a Python shell for ABM prepared by one of the authors of this note, referring to the pioneering proposal http://www.swarm.org of the Santa Fe Institute.

References

Bellomo, N., Bingham, R., Chaplain, M. A. J., Dosi, G., Forni, G., Knopoff, D. A., Lowengrub,, J., Twarock, R., and Virgillito, M. E. (2020). A multi-scale model of virus pandemic: Heterogeneous interactive entities in a globally connected world. arXiv e-prints, art. arXiv:2006.03915, June.

Ghorbani, A., Lorig, F., de Bruin, B., Davidsson, P., Dignum, F., Dignum, V., van der Hurk, M., Jensen, M., Kammler, C., Kreulen, K., et al. (2020). The ASSOCC Simulation Model: A Response to the Community Call for the COVID-19 Pandemic. Review of Artificial Societies and Social Simulation. URL https://rofasss.org/2020/04/25/the-assocc-simulation-model/.

Horton, R. (2020). Offline: Covid-19 is not a pandemic. Lancet (London, England), 396(10255):874. URL https://www.thelancet.com/action/showPdf?pii=S0140-6736%2820%2932000-6.

Silvagno, F., Vernone, A. and Pescarmona, G. P. (2020). The Role of Glutathione in Protecting against the Severe Inflammatory Response Triggered by COVID-19. In «Antioxidants», vol. 9(7), p. 624. http://dx.doi.org/10.3390/antiox9070624.

Steinmann P., Wang J. R., van Voorn G. A., and Kwakkel J. H. (2020). Don’t try to predict covid-19. if you must, use deep uncertainty methods. Review of Artificial Societies and Social Simulation, 17. https://rofasss.org/2020/04/17/deep-uncertainty/.


Pescarmona, G., Terna, P., Acquadro, A., Pescarmona, P., Russo, G., and Terna, S. (2020) How Can ABM Models Become Part of the Policy-Making Process in Times of Emergencies - The S.I.S.A.R. Epidemic Model. Review of Artificial Societies and Social Simulation, 20th Oct 2020. https://rofasss.org/2020/10/20/sisar/


© The authors under the Creative Commons’ Attribution-NoDerivs (CC BY-ND) Licence (v4.0)
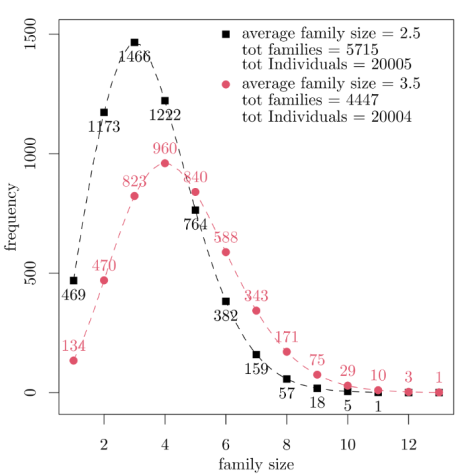
Flu and Coronavirus Simulator – A geospatial agent-based simulator for analyzing COVID-19 spread and public health measures on local regions

By Imran Mahmood

A Summary of: Mahmood et al. (2020)

In this paper we reviewed the lessons learned during the development of the ‘Flu and Coronavirus Simulator’ (FACS) and compare our chosen Agent-based Simulation approach with the conventional disease modelling approaches.

FACS provides an open-ended platform for the specification and implementation of the primary components of Agent-Based Simulation (ABS): (i) Agents; (ii) Virtual environment and (iii) Rule-set using a systematic Simulation Development Approach. FACS inherits features of a comprehensive simulation framework from its ancestors: (i) FLEE (Groen & Arabnejad, 2015) and (ii) FabSim3 (Groen & Arabnejad 2014). Where, FLEE mainly specializes in ABS complex dynamics e.g., agent movements; FabSim3 provides the ability to simulate a large population of agents with microscopic details using remote supercomputers. The combination of this legacy code offers numerous benefits including high performance, high scalability, and greater re-usability through a model coupling. Hence it provides an open-ended API for modellers and programmers to use it for further scientific research and development. FACS generalizes the process of disease modelling and provides a template to model any infectious disease. Thus allowing: (i) non-programmers (e.g., epidemiologists and healthcare data scientists) to use the framework as a disease modelling suite; and (ii) providing an open-ended API for modellers and programmers to use it for further scientific research and development. FACS offers a built-in location graph construction tool that allows the import of large spatial data-sets (e.g., Open Street Map), automated parsing and pre-processing of the spatial data, and generating buildings of various types, thus allowing ease in the synthesis of the virtual environment for the region under consideration. FACS provides a realistic disease transmission algorithm with the ability to capture population interactions and demographic patterns e.g., age diversity, daily life activities, mobility patterns, exposure at the street-level or in public transportation, use, or no use of face mask, assumptions of exposure within closed quarters.

We believe our approach has proven to be quite productive in modelling complex systems like epidemic spread in large regions due to ever-changing model requirements, multi-resolution abstraction, non-linear system dynamics, rule-based heuristics, and above all large-scale computing requirements. During the development of this framework, we learned that the real-world abstraction changes more rapidly than in other circumstances. For instance, the concept of social distancing and lockdown scenarios have evolved significantly since early March. Therefore, rapid changes in the ABS model were necessary. Model building in these cases benefits more from using a bottom-up approach like ABS, as opposed to any centralized analytical solution.

References

Groen, D., & Arabnejad, H. (2014). Fabsim3. GitHub. https://github.com/djgroen/FabSim3

Groen, D., & Arabnejad, H. (2015). Flee. GitHub. https:// github.com/djgroen/flee

Mahmood, I.,  Arabnejad, H., Suleimenova, D., Sassoon, I.,  Marshan, A.,  Serrano-Rico, A.,  Louvieris, P., Anagnostou, A., Taylor, S.J.E., Bell, D. & Groen, D. (2020) FACS: a geospatial agent-based simulator for analysing COVID-19 spread and public health measures on local regions, Journal of Simulation, DOI: 10.1080/17477778.2020.1800422


Mahmood, I. (2020) Flu and Coronavirus Simulator - A geospatial agent-based simulator for analyzing COVID-19 spread and public health measures on local regions. Review of Artificial Societies and Social Simulation, 10th Sept 2020. https://rofasss.org/2020/09/10/facs/


© The authors under the Creative Commons’ Attribution-NoDerivs (CC BY-ND) Licence (v4.0)
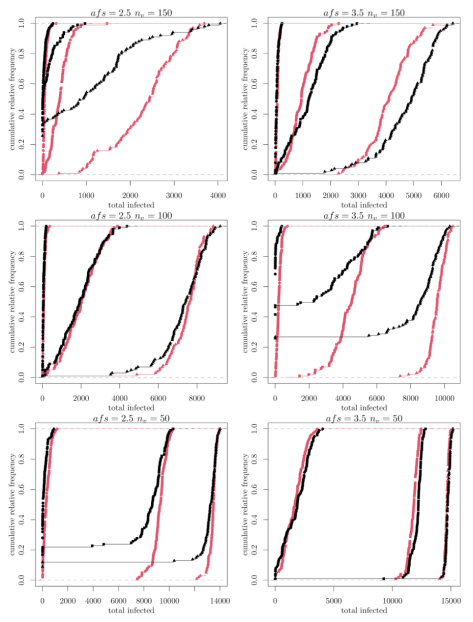
The role of population scale in compartmental models of COVID-19 transmission

By Christopher J. Watts1,*, Nigel Gilbert2, Duncan Robertson3, 4, Laurence T. Droy5, Daniel Ladley6and Edmund Chattoe-Brown5

*Corresponding author, 12 Manor Farm Cottages, Waresley, Sandy, SG19 3BZ, UK, 2Centre for Research in Social Simulation (CRESS), University of Surrey, Guildford GU2 7XH, UK, 3School of Business and Economics, Loughborough University, Loughborough, UK, 4St Catherine’s College, University of Oxford, Oxford, UK, 5School of Media, Communication and Sociology, University of Leicester, UK, 6University of Leicester School of Business, University of Leicester, Leicester, LE17RH, UK

(A contribution to the: JASSS-Covid19-Thread)

Compartmental models of COVID-19 transmission have been used to inform policy, including the decision to temporarily reduce social contacts among the general population (“lockdown”). One such model is a Susceptible-Exposed-Infectious-Removed (SEIR) model developed by a team at the London School of Hygiene and Tropical Medicine (hereafter, “the LSHTM model”, Davies et al., 2020a). This was used to evaluate the impact of several proposed interventions on the numbers of cases, deaths, and intensive care unit (ICU) hospital beds required in the UK. We wish here to draw attention to behaviour common to this and other compartmental models of diffusion, namely their sensitivity to the size of the population simulated and the number of seed infections within that population. This sensitivity may compromise any policy advice given.

We therefore describe below the essential details of the LSHTM model, our experiments on its sensitivity, and why they matter to its use in policy making.

The LSHTM model

Compartmental models of disease transmission divide members of a population according to their disease states, including at a minimum people who are “susceptible” to a disease, and those who are “infectious”. Susceptible individuals make social contact with others within the same population at given rates, with no preference for the other’s disease state, spatial location, or social networks (the “universal mixing” assumption). Social contacts result in infections with a chance proportional to the fraction of the population who are currently infectious. Perhaps to reduce the implausibility of the universal mixing assumption, the LSHTM model is run for each of 186 county-level administrative units (“counties”, having an average size of 357,000 people), instead of a single run covering the whole UK population (66.4 million). Each county receives the same seed infection schedule: two new infections per day for 28 days. The 186 county time series are then summed to form a time series for the UK. There are no social contacts between counties, and the 186 county-level runs are independent of each other. Outputs from the model include total and peak cases and deaths, ICU and non-ICU hospital bed occupancy, and the time to peak cases, all reported for the UK as a whole.

Interventions are modelled as 12-week reductions in contact rates, and, in the first experiment, scheduled to commence 6 weeks prior to the peak in UK cases with no intervention. Further experiments shift the start of the intervention, and trigger the intervention upon reaching a given number of ICU beds, rather than a specific time.

Studying sensitivity to population size

The 186 counties vary in their population sizes, from Isles of Scilly (2,242 people) to West Midlands (2.9 million). We investigated whether the variation in population size led to differences in model behaviour. The LSHTM model files were cloned from https://github.com/cmmid/covid-UK , while the data analysis was performed using our own scripts posted at https://github.com/innovative-simulator/PopScaleCompartmentModels .

A graph showing Peak week infections against population size (on a log scale). The peak week looks increasing linear (with the log population scale), but there is a uniform increase in peak week with more seed infections.The figure above shows the results of running the LSHTM model with populations of various sizes, each point being an average of 10 repetitions. The time, in weeks, to the peak in cases forms a linear trend with the base-10 logarithm of population. A linear regression line fitted to these points gives Peak Week = 2.70 log10(Population) – 2.80, with R2 = 0.999.

To help understand this relationship, we then compared the seeding used by the LSHTM team, i.e. 2 infectious persons per day for 28 days, to two forms of reduced seeding, 1 per day for 28 days, and 2 per day for 14 days. Halving the seeding is similar in effect, but not identical to, doubling the population size.

Deterministic versions of other compartmental models of transmission (SIR, SEIR, SI) confirmed the relation between population size and time of occurrence to be a common feature of such models. See the R and Excel files at: https://github.com/innovative-simulator/PopScaleCompartmentModels .

For the simplest, the SI model, the stock of infectious people is described by the logistic function.I(t)=N/(1+exp(-u*C*(t-t*)))Here N is the population size, u susceptibility, and C the contact rate. If I(0)=s, the number of seed infections, then it can be shown that the peak in new infections, I(t*), occurs at timet*=ln(N/s-1)/(u*C)

Hence, for N/s >> 1, the time to peak cases, t*, correlates well with log10N/s.

As well as peak cases, analogous sensitivity was found for the timing of peaks in infections and hospital admissions, and for reaching critical levels, such as the hospital bed capacity as a proportion of the population. In contrast, the heights of peaks, and totals of cases, deaths and beds were constant percentages of population when population size was varied.

Why the unit of population matters

Davies et al. (2020a) make forecasts of both the level of peak cases and the timing of their occurrence. Despite showing that two counties can vary in their results (Davies et al., 2020a, p. 6), and mentioning in the supplementary material some effects of changing the seeding schedule (Davies et al., 2020b, p. 5), they do not mention any sensitivity to population size. But, as we have shown here, given the same number and timing of seed infections, the county with the smallest population will peak in cases earlier than the one with the largest. This sensitivity to population size affects the arguments of Davies et al. in several ways.

Firstly, Davies et al. produce their forecasts for the UK by summing county-level time series. But counties with out-of-sync peaks will sum to produce a shorter, flatter peak for the UK, than would have been achieved by synchronous county peaks. Thus the forecasts of peak cases for the UK are being systematically biased down.

Secondly, timing is important for the effectiveness of the interventions. As Davies et al. note in relation to their experiment on shifting the start time of the intervention, an intervention can be too early or too late. It is too early if, when it ends after 12 weeks, the majority of the population is still susceptible to any remaining infectious cases, and a serious epidemic can still occur. At the other extreme, an intervention can be too late if it starts when most of the epidemic has already occurred.

A timing problem also threatens if the intervention is triggered by the occupancy of ICU beds reaching some critical level. This level will be reached for the UK or average county later than for a small county. Thus the problem extends beyond the timing of peaks to affect other aspects of a policy supported by the model.

Our results imply that an intervention timed optimally for a UK-level, or average county-level, cases peak, as well as an intervention triggered by a UK-level beds occupancy threshold, may be less effective for counties with far-from-average sizes.

There are multiple ways of resolving these issues, including re-scaling seed infections in line with size of population unit, simulating the UK directly rather than as a sum of counties, and rejecting compartmental models in favour of network- or agent-based models. A discussion of the respective pros and cons of these alternatives requires a longer paper. For now, we note that compartmental models remain quick and cheap to design, fit, and study. The issues with Davies et al. (2020a) we have drawn attention to here highlight (1) the importance of adequate sensitivity testing, (2) the need for care when choosing at which scale to model and how to seed an infection, and (3) the problems that can stem from uniform national policy interventions, rather than ones targeted at a more local level.

References

Davies, N. G., Kucharski, A. J., Eggo, R. M., Gimma, A., Edmunds, W. J., Jombart, T., . . . Liu, Y. (2020a). Effects of non-pharmaceutical interventions on COVID-19 cases, deaths, and demand for hospital services in the UK: a modelling study. The Lancet Public Health, 5(7), e375-e385. doi:10.1016/S2468-2667(20)30133-X

Davies, N. G., Kucharski, A. J., Eggo, R. M., Gimma, A., Edmunds, W. J., Jombart, T., . . . Liu, Y. (2020b). Supplement to Davies et al. (2020b). https://www.thelancet.com/cms/10.1016/S2468-2667(20)30133-X/attachment/cee85e76-cffb-42e5-97b6-06a7e1e2379a/mmc1.pdf


Watts, C.J., Gilbert, N., Robertson, D., Droy, L.T., Ladley, D and Chattoe-Brown, E. (2020) The role of population scale in compartmental models of COVID-19 transmission. Review of Artificial Societies and Social Simulation, 14th August 2020. https://rofasss.org/2020/08/14/role-population-scale/


© The authors under the Creative Commons’ Attribution-NoDerivs (CC BY-ND) Licence (v4.0)
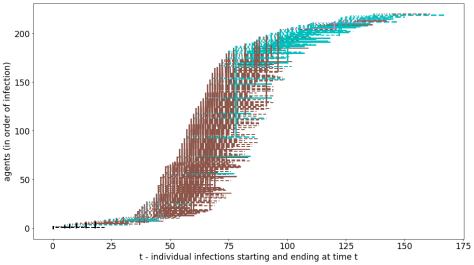
The Policy Context of Covid19 Agent-Based Modelling

By Edmund Chattoe-Brown

(A contribution to the: JASSS-Covid19-Thread)

In the recent discussions about the role of ABM and COVID, there seems to be an emphasis on the purely technical dimensions of modelling. This obviously involves us “playing to our strengths” but unfortunately it may reduce the effectiveness that our potential policy contributions can make. Here are three contextual aspects of policy for consideration to provide a contrast/corrective.

What is “Good” Policy?

Obviously from a modelling perspective good policy involves achieving stated goals. So a model that suggests a lower death rate (or less taxing of critical care facilities) under one intervention rather than another is a potential argument for that intervention. (Though of course how forceful the argument is depends on the quality of the model.) But the problem is that policy is predominantly a political and not a technical process (related arguments are made by Edmonds 2020). The actual goals by which a policy is evaluated may not be limited to the obvious technical ones (even if that is what we hear most about in the public sphere) and, most problematically, there may be goals which policy makers are unwilling to disclose. Since we do not know what these goals are, we cannot tell whether their ends are legitimate (having to negotiate privately with the powerful to achieve anything) or less so (getting re-elected as an end in itself).

Of course, by its nature (being based on both power and secrecy), this problem may be unfixable but even awareness of it may change our modelling perspective in useful ways. Firstly, when academic advice is accused of irrelevance, the academics can only ever be partly to blame. You can only design good policy to the extent that the policy maker is willing to tell you the full evaluation function (to the extent that they know it of course). Obviously, if policy is being measured by things you can’t know about, your advice is at risk of being of limited value. Secondly, with this is mind, we may be able to gain some insight into the hidden agenda of policy by looking at what kind of suggestions tend to be accepted and rejected. Thirdly, once we recognise that there may be “unknown unknowns” we can start to conjecture intelligently about what these could be and take some account of them in our modelling strategies. For example, how many epidemic models consider the financial costs of interventions even approximately? Is the idea that we can and will afford whatever it takes to reduce deaths a blind spot of the “medical model?”

When and How to Intervene

There used to be an (actually rather odd) saying: “You can’t get a baby in a month by making nine women pregnant”. There has been a huge upsurge in interest regarding modelling and its relationship to policy since start of the COVID crisis (of which this theme is just one example) but realising the value of this interest currently faces significant practical problems. Data collection is even harder than usual (as is scholarship in general), there is a limit to how fast good research can ever be done, peer review takes time and so on. The question here is whether any amount of rushing around at the present moment will compensate for neglected activities when scholarship was easier and had more time (an argument also supported by Bithell 2018). The classic example is the muttering in the ABM community about the Ferguson model being many thousands of lines of undocumented C code. Now we are in a crisis, even making the model available was a big ask, let alone making it easier to read so that people might “heckle” it. But what stopped it being available, documented, externally validated and so on before COVID? What do we need to do so that next time there is a pandemic crisis, which there surely will be, “we” (the modelling community very broadly defined) are able to offer the government a “ready” model that has the best features of various modelling techniques, evidence of unfudgeable quality against data, relevant policy scenarios and so on? (Specifically, how will ABM make sure it deserves to play a fit part in this effort?) Apart from the models themselves, what infrastructures, modelling practices, publishing requirements and so on do we need to set up and get working well while we have the time? In practice, given the challenges of making effective contributions right now (and the proliferation of research that has been made available without time for peer review may be actively harmful), this perspective may be the most important thing we can realistically carry into the “post lockdown” world.

What Happens Afterwards?

ABM has taken such a long time to “get to” policy based on data that looking further than the giving of such advice simply seems to have been beyond us. But since policy is what actually happens, we have a serious problem with counterfactuals. If the government decides to “flatten the curve” rather than seek “herd immunity” then we know how the policy implemented relates to the model “findings” (for good or ill) but not how the policy that was not implemented does. Perhaps the outturn of the policy that looked worse in the model would actually have been better had it been implemented?

Unfortunately (this is not a typo), we are about to have an unprecedently large social data set of comparative experiments in the nature and timing of epidemiological interventions, but ABM needs to be ready and willing to engage with this data. I think that ABM probably has a unique contribution to make in “endogenising” the effects of policy implementation and compliance (rather than seeing these, from a “model fitting” perspective, as structural changes to parameter values) but to make this work, we need to show much more interest in data than we have to date.

In 1971, Dutton and Starbuck, in a worryingly neglected article (cited only once in JASSS since 1998 and even then not in respect of model empirics) reported that 81% of the models they surveyed up to 1969 could not achieve even qualitative measurement in both calibration and validation (with only 4% achieving quantitative measurement in both). As a very rough comparison (but still the best available), Angus and Hassani-Mahmooei (2015) showed that just 13% of articles in JASSS published between 2010 and 2012 displayed “results elements” both from the simulation and using empirical material (but the reader cannot tell whether these are qualitative or quantitative elements or whether their joint presence involves comparison as ABM methodology would indicate). It would be hard to make the case that the situation in respect to ABM and data has therefore improved significantly in 4 decades and it is at least possible that it has got worse!

For the purposes of policy making (in the light of the comments above), what matters of course is not whether the ABM community believes that models without data continue to make a useful contribution but whether policy makers do.

References

Angus, S. D. and Hassani-Mahmooei, B. (2015) “Anarchy” Reigns: A Quantitative Analysis of Agent-Based Modelling Publication Practices in JASSS, 2001-2012, Journal of Artificial Societies and Social Simulation, 18(4), 16. doi:10.18564/jasss.2952

Bithell, M. (2018) Continuous model development: a plea for persistent virtual worlds, Review of Artificial Societies and Social Simulation, 22nd August 2018. https://rofasss.org/2018/08/22/mb

Dutton, John M. and Starbuck, William H. (1971) Computer Simulation Models of Human Behavior: A History of an Intellectual Technology. IEEE Transactions on Systems, Man, and Cybernetics, SMC-1(2), 128–171. doi:10.1109/tsmc.1971.4308269

Edmonds, B. (2020) What more is needed for truly democratically accountable modelling? Review of Artificial Societies and Social Simulation, 2nd May 2020. https://rofasss.org/2020/05/02/democratically-accountable-modelling/


Chattoe-Brown, E. (2020) The Policy Context of Covid19 Agent-Based Modelling. Review of Artificial Societies and Social Simulation, 4th May 2020. https://rofasss.org/2020/05/04/policy-context/


© The authors under the Creative Commons’ Attribution-NoDerivs (CC BY-ND) Licence (v4.0)
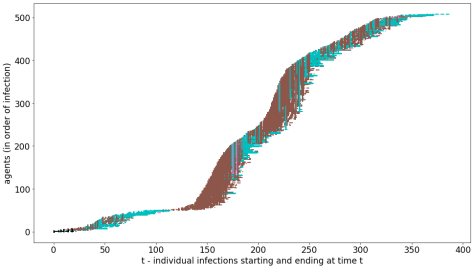
What more is needed for Democratically Accountable Modelling?

By Bruce Edmonds

(A contribution to the: JASSS-Covid19-Thread)

In the context of the Covid19 outbreak, the (Squazzoni et al 2020) paper argued for the importance of making complex simulation models open (a call reiterated in Barton et al 2020) and that relevant data needs to be made available to modellers. These are important steps but, I argue, more is needed.

The Central Dilemma

The crux of the dilemma is as follows. Complex and urgent situations (such as the Covid19 pandemic) are beyond the human mind to encompass – there are just too many possible interactions and complexities. For this reason one needs complex models, to leverage some understanding of the situation as a guide for what to do. We can not directly understand the situation, but we can understand some of what a complex model tells us about the situation. The difficulty is that such models are, themselves, complex and difficult to understand. It is easy to deceive oneself using such a model. Professional modellers only just manage to get some understanding of such models (and then, usually, only with help and critique from many other modellers and having worked on it for some time: Edmonds 2020) – politicians and the public have no chance of doing so. Given this situation, any decision-makers or policy actors are in an invidious position – whether to trust what the expert modellers say if it contradicts their own judgement. They will be criticised either way if, in hindsight, that decision appears to have been wrong. Even if the advice supports their judgement there is the danger of giving false confidence.

What options does such a policy maker have? In authoritarian or secretive states there is no problem (for the policy makers) – they can listen to who they like (hiring or firing advisers until they get advice they are satisfied with), and then either claim credit if it turned out to be right or blame the advisers if it was not. However, such decisions are very often not value-free technocratic decisions, but ones that involve complex trade-offs that affect people’s lives. In these cases the democratic process is important for getting good (or at least accountable) decisions. However, democratic debate and scientific rigour often do not mix well [note 1].

A Cautionary Tale

As discussed in (Adoha & Edmonds 2019) Scientific modelling can make things worse, as in the case of the North Atlantic Cod Fisheries Collapse. In this case, the modellers became enmeshed within the standards and wishes of those managing the situation and ended up confirming their wishful thinking. An effect of technocratising the decision-making about how much it is safe to catch had the effect of narrowing down the debate to particular measurement and modelling processes (which turned out to be gravely mistaken). In doing so the modellers contributed to the collapse of the industry, with severe social and ecological consequences.

What to do?

How to best interface between scientific and policy processes is not clear, however some directions are becoming apparent.

  • That the process of developing and giving advice to policy actors should become more transparent, including who is giving advice and on what basis. In particular, any reservations or caveats that the experts add should be open to scrutiny so the line between advice (by the experts) and decision-making (by the politicians) is clearer.
  • That such experts are careful not to over-state or hype their own results. For example, implying that their model can predict (or forecast) the future of complex situations and so anticipate the effects of policy before implementation (de Matos Fernandes and Keijzer 2020). Often a reliable assessment of results only occurs after a period of academic scrutiny and debate.
  • Policy actors need to learn a little bit about modelling, in particular when and how modelling can be reliably used. This is discussed in (Government Office for Science 2018, Calder et al. 2018) which also includes a very useful checklist for policy actors who deal with modellers.
  • That the public learn some maturity about the uncertainties in scientific debate and conclusions. Preliminary results and critiques tend to be jumped on too early to support one side within polarised debate or models rejected simply on the grounds they are not 100% certain. We need to collectively develop ways of facing and living with uncertainty.
  • That the decision-making process is kept as open to input as possible. That the modelling (and its limitations) should not be used as an excuse to limit what the voices that are heard, or the debate to a purely technical one, excluding values (Aodha & Edmonds 2017).
  • That public funding bodies and journals should insist on researchers making their full code and documentation available to others for scrutiny, checking and further development (readers can help by signing the Open Modelling Foundation’s open letter and the campaign for Democratically Accountable Modelling’s manifesto).

Some Relevant Resources

  • CoMSeS.net — a collection of resources for computational model-based science, including a platform for publicly sharing simulation model code and documentation and forums for discussion of relevant issues (including one for covid19 models)
  • The Open Modelling Foundation — an international open science community that works to enable the next generation modelling of human and natural systems, including its standards and methodology.
  • The European Social Simulation Association — which is planning to launch some initiatives to encourage better modelling standards and facilitate access to data.
  • The Campaign for Democratic Modelling — which campaigns concerning the issues described in this article.

Notes

note1: As an example of this see accounts of the relationship between the UK scientific advisory committees and the Government in the Financial Times and BuzzFeed.

References

Barton et al. (2020) Call for transparency of COVID-19 models. Science, Vol. 368(6490), 482-483. doi:10.1126/science.abb8637

Aodha, L.Edmonds, B. (2017) Some pitfalls to beware when applying models to issues of policy relevance. In Edmonds, B. & Meyer, R. (eds.) Simulating Social Complexity – a handbook, 2nd edition. Springer, 801-822. (see also http://cfpm.org/discussionpapers/236)

Calder, M., Craig, C., Culley, D., de Cani, R., Donnelly, C.A., Douglas, R., Edmonds, B., Gascoigne, J., Gilbert, N. Hargrove, C., Hinds, D., Lane, D.C., Mitchell, D., Pavey, G., Robertson, D., Rosewell, B., Sherwin, S., Walport, M. & Wilson, A. (2018) Computational modelling for decision-making: where, why, what, who and how. Royal Society Open Science,

Edmonds, B. (2020) Good Modelling Takes a Lot of Time and Many Eyes. Review of Artificial Societies and Social Simulation, 13th April 2020. https://rofasss.org/2020/04/13/a-lot-of-time-and-many-eyes/

de Matos Fernandes, C. A. and Keijzer, M. A. (2020) No one can predict the future: More than a semantic dispute. Review of Artificial Societies and Social Simulation, 15th April 2020. https://rofasss.org/2020/04/15/no-one-can-predict-the-future/

Government Office for Science (2018) Computational Modelling: Technological Futures. https://www.gov.uk/government/publications/computational-modelling-blackett-review

Squazzoni, F., Polhill, J. G., Edmonds, B., Ahrweiler, P., Antosz, P., Scholz, G., Chappin, É., Borit, M., Verhagen, H., Giardini, F. and Gilbert, N. (2020) Computational Models That Matter During a Global Pandemic Outbreak: A Call to Action. Journal of Artificial Societies and Social Simulation, 23(2):10. <http://jasss.soc.surrey.ac.uk/23/2/10.html>. doi: 10.18564/jasss.4298


Edmonds, B. (2020) What more is needed for truly democratically accountable modelling? Review of Artificial Societies and Social Simulation, 2nd May 2020. https://rofasss.org/2020/05/02/democratically-accountable-modelling/


© The authors under the Creative Commons’ Attribution-NoDerivs (CC BY-ND) Licence (v4.0)