
By Christopher J. Watts1,*, Nigel Gilbert2, Duncan Robertson3, 4, Laurence T. Droy5, Daniel Ladley6and Edmund Chattoe-Brown5
*Corresponding author, 12 Manor Farm Cottages, Waresley, Sandy, SG19 3BZ, UK, 2Centre for Research in Social Simulation (CRESS), University of Surrey, Guildford GU2 7XH, UK, 3School of Business and Economics, Loughborough University, Loughborough, UK, 4St Catherine’s College, University of Oxford, Oxford, UK, 5School of Media, Communication and Sociology, University of Leicester, UK, 6University of Leicester School of Business, University of Leicester, Leicester, LE17RH, UK
(A contribution to the: JASSS-Covid19-Thread)
Compartmental models of COVID-19 transmission have been used to inform policy, including the decision to temporarily reduce social contacts among the general population (“lockdown”). One such model is a Susceptible-Exposed-Infectious-Removed (SEIR) model developed by a team at the London School of Hygiene and Tropical Medicine (hereafter, “the LSHTM model”, Davies et al., 2020a). This was used to evaluate the impact of several proposed interventions on the numbers of cases, deaths, and intensive care unit (ICU) hospital beds required in the UK. We wish here to draw attention to behaviour common to this and other compartmental models of diffusion, namely their sensitivity to the size of the population simulated and the number of seed infections within that population. This sensitivity may compromise any policy advice given.
We therefore describe below the essential details of the LSHTM model, our experiments on its sensitivity, and why they matter to its use in policy making.
The LSHTM model
Compartmental models of disease transmission divide members of a population according to their disease states, including at a minimum people who are “susceptible” to a disease, and those who are “infectious”. Susceptible individuals make social contact with others within the same population at given rates, with no preference for the other’s disease state, spatial location, or social networks (the “universal mixing” assumption). Social contacts result in infections with a chance proportional to the fraction of the population who are currently infectious. Perhaps to reduce the implausibility of the universal mixing assumption, the LSHTM model is run for each of 186 county-level administrative units (“counties”, having an average size of 357,000 people), instead of a single run covering the whole UK population (66.4 million). Each county receives the same seed infection schedule: two new infections per day for 28 days. The 186 county time series are then summed to form a time series for the UK. There are no social contacts between counties, and the 186 county-level runs are independent of each other. Outputs from the model include total and peak cases and deaths, ICU and non-ICU hospital bed occupancy, and the time to peak cases, all reported for the UK as a whole.
Interventions are modelled as 12-week reductions in contact rates, and, in the first experiment, scheduled to commence 6 weeks prior to the peak in UK cases with no intervention. Further experiments shift the start of the intervention, and trigger the intervention upon reaching a given number of ICU beds, rather than a specific time.
Studying sensitivity to population size
The 186 counties vary in their population sizes, from Isles of Scilly (2,242 people) to West Midlands (2.9 million). We investigated whether the variation in population size led to differences in model behaviour. The LSHTM model files were cloned from https://github.com/cmmid/covid-UK , while the data analysis was performed using our own scripts posted at https://github.com/innovative-simulator/PopScaleCompartmentModels .
 The figure above shows the results of running the LSHTM model with populations of various sizes, each point being an average of 10 repetitions. The time, in weeks, to the peak in cases forms a linear trend with the base-10 logarithm of population. A linear regression line fitted to these points gives Peak Week = 2.70 log10(Population) – 2.80, with R2 = 0.999.
To help understand this relationship, we then compared the seeding used by the LSHTM team, i.e. 2 infectious persons per day for 28 days, to two forms of reduced seeding, 1 per day for 28 days, and 2 per day for 14 days. Halving the seeding is similar in effect, but not identical to, doubling the population size.
Deterministic versions of other compartmental models of transmission (SIR, SEIR, SI) confirmed the relation between population size and time of occurrence to be a common feature of such models. See the R and Excel files at: https://github.com/innovative-simulator/PopScaleCompartmentModels .
For the simplest, the SI model, the stock of infectious people is described by the logistic function. Here N is the population size, u susceptibility, and C the contact rate. If I(0)=s, the number of seed infections, then it can be shown that the peak in new infections, I(t*), occurs at time
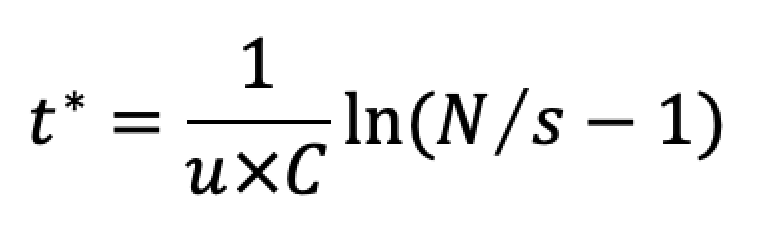
Hence, for N/s >> 1, the time to peak cases, t*, correlates well with log10N/s.
As well as peak cases, analogous sensitivity was found for the timing of peaks in infections and hospital admissions, and for reaching critical levels, such as the hospital bed capacity as a proportion of the population. In contrast, the heights of peaks, and totals of cases, deaths and beds were constant percentages of population when population size was varied.
Why the unit of population matters
Davies et al. (2020a) make forecasts of both the level of peak cases and the timing of their occurrence. Despite showing that two counties can vary in their results (Davies et al., 2020a, p. 6), and mentioning in the supplementary material some effects of changing the seeding schedule (Davies et al., 2020b, p. 5), they do not mention any sensitivity to population size. But, as we have shown here, given the same number and timing of seed infections, the county with the smallest population will peak in cases earlier than the one with the largest. This sensitivity to population size affects the arguments of Davies et al. in several ways.
Firstly, Davies et al. produce their forecasts for the UK by summing county-level time series. But counties with out-of-sync peaks will sum to produce a shorter, flatter peak for the UK, than would have been achieved by synchronous county peaks. Thus the forecasts of peak cases for the UK are being systematically biased down.
Secondly, timing is important for the effectiveness of the interventions. As Davies et al. note in relation to their experiment on shifting the start time of the intervention, an intervention can be too early or too late. It is too early if, when it ends after 12 weeks, the majority of the population is still susceptible to any remaining infectious cases, and a serious epidemic can still occur. At the other extreme, an intervention can be too late if it starts when most of the epidemic has already occurred.
A timing problem also threatens if the intervention is triggered by the occupancy of ICU beds reaching some critical level. This level will be reached for the UK or average county later than for a small county. Thus the problem extends beyond the timing of peaks to affect other aspects of a policy supported by the model.
Our results imply that an intervention timed optimally for a UK-level, or average county-level, cases peak, as well as an intervention triggered by a UK-level beds occupancy threshold, may be less effective for counties with far-from-average sizes.
There are multiple ways of resolving these issues, including re-scaling seed infections in line with size of population unit, simulating the UK directly rather than as a sum of counties, and rejecting compartmental models in favour of network- or agent-based models. A discussion of the respective pros and cons of these alternatives requires a longer paper. For now, we note that compartmental models remain quick and cheap to design, fit, and study. The issues with Davies et al. (2020a) we have drawn attention to here highlight (1) the importance of adequate sensitivity testing, (2) the need for care when choosing at which scale to model and how to seed an infection, and (3) the problems that can stem from uniform national policy interventions, rather than ones targeted at a more local level.
References
Davies, N. G., Kucharski, A. J., Eggo, R. M., Gimma, A., Edmunds, W. J., Jombart, T., . . . Liu, Y. (2020a). Effects of non-pharmaceutical interventions on COVID-19 cases, deaths, and demand for hospital services in the UK: a modelling study. The Lancet Public Health, 5(7), e375-e385. doi:10.1016/S2468-2667(20)30133-X
Davies, N. G., Kucharski, A. J., Eggo, R. M., Gimma, A., Edmunds, W. J., Jombart, T., . . . Liu, Y. (2020b). Supplement to Davies et al. (2020b). https://www.thelancet.com/cms/10.1016/S2468-2667(20)30133-X/attachment/cee85e76-cffb-42e5-97b6-06a7e1e2379a/mmc1.pdf
Watts, C.J., Gilbert, N., Robertson, D., Droy, L.T., Ladley, D and Chattoe-Brown, E. (2020) The role of population scale in compartmental models of COVID-19 transmission. Review of Artificial Societies and Social Simulation, 14th August 2020. https://rofasss.org/2020/08/14/role-population-scale/
© The authors under the Creative Commons’ Attribution-NoDerivs (CC BY-ND) Licence (v4.0)
